

Question
Table Frequencies by grades and shirt color Shirt Color A B Blue Shirt 20 10 Red Shirt Total C 4 7 3 11 27 13
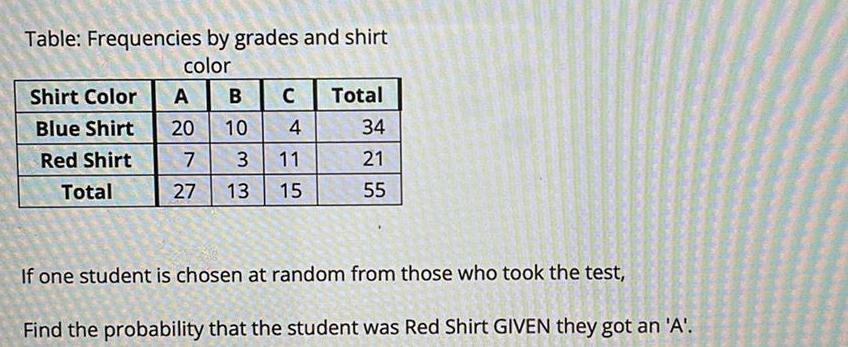

Table Frequencies by grades and shirt color Shirt Color A B Blue Shirt 20 10 Red Shirt Total C 4 7 3 11 27 13 15 Total 34 21 55 If one student is chosen at random from those who took the test Find the probability that the student was Red Shirt GIVEN they got an A
Step by Step Solution
There are 3 Steps involved in it
Step: 1

Get Instant Access to Expert-Tailored Solutions
See step-by-step solutions with expert insights and AI powered tools for academic success
Step: 2

Step: 3
Ace Your Homework with AI
Get the answers you need in no time with our AI-driven, step-by-step assistance
Get Started
CAD/CAM Systems Planning And Implementation
Authors: Charles S Knox
1st Edition
1000146383, 9781000146387