

Question: Table, from a General Social Survey, relates responses on R = religious service attendance (1 = at most a few times a year, 2
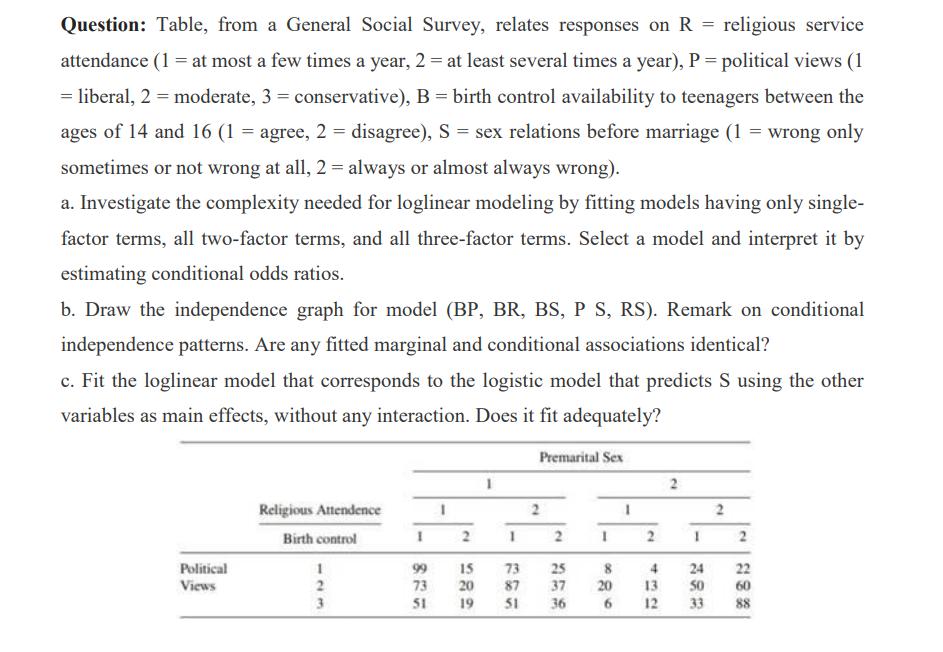
Table, from a General Social Survey, relates responses on R = religious service attendance (1 = at most a few times a year, 2 = at least several times a year), P = political views (1 = liberal, 2 = moderate, 3 = conservative), B = birth control availability to teenagers between the ages of 14 and 16 (1= agree, 2 = disagree), S = sex relations before marriage (1 = wrong only sometimes or not wrong at all, 2 = always or almost always wrong). a. Investigate the complexity needed for loglinear modeling by fitting models having only single- factor terms, all two-factor terms, and all three-factor terms. Select a model and interpret it by estimating conditional odds ratios. b. Draw the independence graph for model (BP, BR, BS, P S, RS). Remark on conditional independence patterns. Are any fitted marginal and conditional associations identical? c. Fit the loglinear model that corresponds to the logistic model that predicts S using the other variables as main effects, without any interaction. Does it fit adequately? Political Views Religious Attendence Birth control 2 23 3 1 2 I 99 15 73 20 51 19 73 87 51 Premarital Sex 2 2 25 8 37 20 36 6 2 2 4 24 50 12 2 2 22 60 88
Step by Step Solution
There are 3 Steps involved in it
The detailed ... View full answer

Get step-by-step solutions from verified subject matter experts