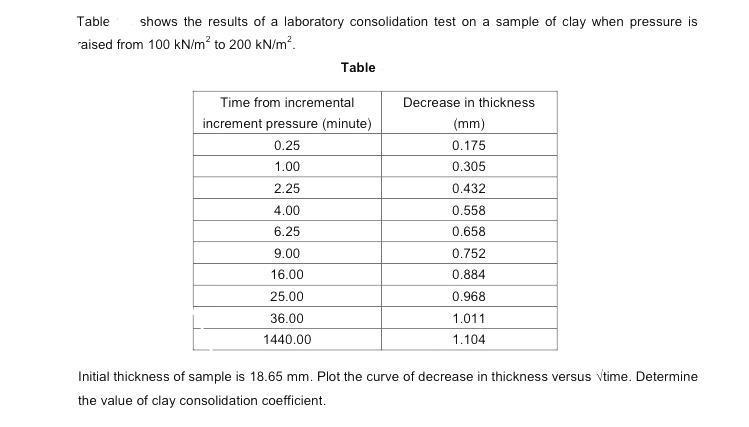
Table shows the results of a laboratory consolidation test on a sample of clay when pressure is raised from 100 kN/m to 200 kN/m.

Table shows the results of a laboratory consolidation test on a sample of clay when pressure is raised from 100 kN/m to 200 kN/m. Table Time from incremental increment pressure (minute) 0.25 1.00 2.25 4.00 6.25 9.00 16.00 25.00 36.00 1440.00 Decrease in thickness (mm) 0.175 0.305 0.432 0.558 0.658 0.752 0.884 0.968 1.011 1.104 Initial thickness of sample is 18.65 mm. Plot the curve of decrease in thickness versus Vtime. Determine the value of clay consolidation coefficient.
Step by Step Solution
3.43 Rating (150 Votes )
There are 3 Steps involved in it
Step: 1
To plot the curve of decrease in thickness versus time and determine the value of the clay consolid...
See step-by-step solutions with expert insights and AI powered tools for academic success
Step: 2

Step: 3

Ace Your Homework with AI
Get the answers you need in no time with our AI-driven, step-by-step assistance
Get Started


