Table1
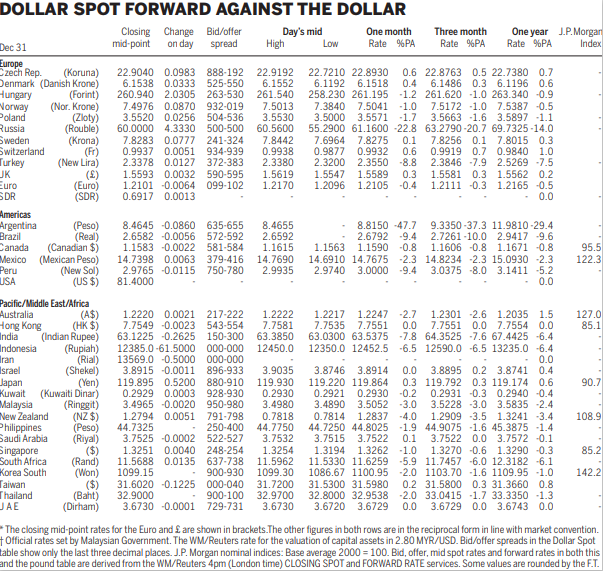
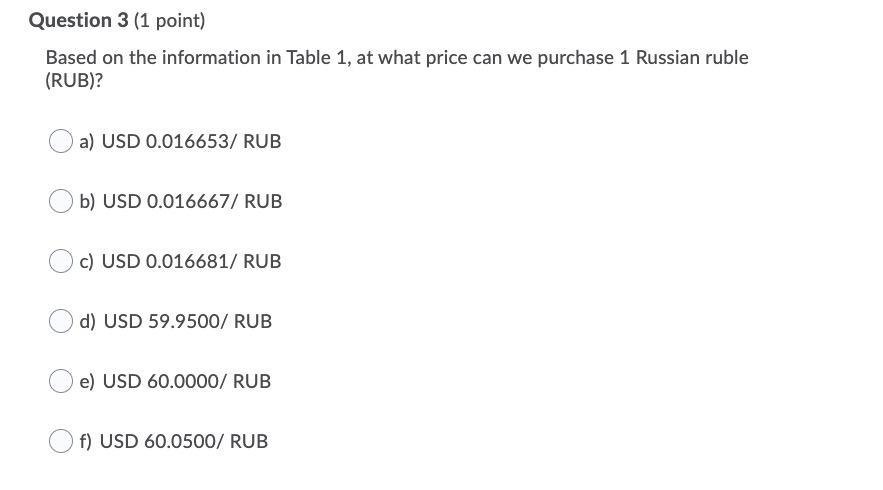
Question 3 (1 point) Based on the information in Table 1, at what price can we purchase 1 Russian ruble (RUB)? a) USD 0.016653/ RUB b) USD 0.016667/ RUB C) USD 0.016681/ RUB d) USD 59.9500/ RUB e) USD 60.0000/ RUB f) USD 60.0500/ RUB Low 0.1 DOLLAR SPOT FORWARD AGAINST THE DOLLAR Closing Change Bid/offer Day's mid One month Three month One year J.P. Morgan mid-point on day spread Dec 31 High Rate %PA Rate %PA Rate %PA Index Europe Czech Rep. (Koruna) 22.9040 0.0983 888-192 22.9192 22.7210 22.8930 0.6 22.8763 0.5 22.7380 0.7 Denmark (Danish Krone) 6.1538 0.0333 525-550 6.1552 6.1192 6.1518 0.4 6.1486 0.3 6.1196 0.6 Hungary (Forint) 260.940 2.0305 263-530 261.540 258.230 261.195 -1.2 261.620 1.0 263.340 -0.9 Norway (Nor. Krone) 7.4976 0.0870 932-019 7.5013 7.3840 7.5041 -1.0 7.5172 -1.0 7.5387 -0.5 Poland (Zloty) 3.5520 0.0256 504-536 3.5530 3.5000 3.5571 -1.7 3.5663 -1.6 3.5897 -1.1 Russia (Rouble) 60.0000 4.3330 500-500 60.5600 55.2900 61.1600 -22.8 63.2790-20.7 69.7325-14.0 Sweden (Krona) 7.8283 0.0777 241-324 7.8442 7.6964 7.8275 7.8256 0.1 7.8015 0.3 Switzerland (Fr) 0.9937 0.0051 934-939 0.9938 0.9877 0.9932 0.6 0.9919 0.7 0.9840 1.0 Turkey (New Lira) 2.3378 0.0127 372-383 2.3380 2.3200 2.3550 -8.8 2.3846 -7.9 2.5269 -7.5 JK (9) 1.5593 0.0032 590-595 1.5619 1.5547 1.5589 0.3 1.5581 0.3 1.5562 0.2 Euro (Euro) 1.2101 -0.0064 099-102 1.2170 1.2096 1.2105 0.4 1.2111 0.3 1.2165 -0.5 SDR (SDR) 0.6917 0.0013 - 0.0 Americas Argentina (Peso) 8.4645 -0.0860 635-655 8.4655 8.8150 -47.7 9.3350-37.3 11.9810-29.4 Brazil (Real) 2.6582 -0.0056 572-592 2.6592 2.6792 -9.4 2.7261-10.0 2.9417 -9.6 Canada (Canadian $) 1.1583 -0.0022 581-584 1.1615 1.1563 1.1590 0.8 1.1606 -0.8 1.1671 -0.8 95.5 Mexico (Mexican Peso) 14.7398 0.0063 379-416 14.7690 14.6910 14.7675 -2.3 14.8234 2.3 15.0930 2.3 122.3 Peru (New Sol) 2.9765 -0.0115 750-780 2.9935 2.9740 3.0000 -9.4 3.0375 -8.0 3.1411 -5.2 USA (US$) 81.4000 0.0 Pacific/Middle East/Africa Australia 1.2220 0.0021 217-222 1.2222 1.2217 1.2247 -2.7 1.2301 2.6 1.2035 1.5 127.0 Hong Kong (HK$) 7.7549 -0.0023 543-554 7.7581 7.7535 7.7551 0.0 7.7551 0.0 7.7554 0.0 85.1 India (Indian Rupee) 63.1225 -0.2625 150-300 63.3850 63.0300 63.5375 -7.8 64.3525 -7.6 67.4425 -6.4 Indonesia (Rupiah) 12385.0-61.5000 000-000 12450.0 12350.0 12452.5 -6.5 12590.0 -6.5 13235.0 -6.4 Iran (Rial) 13569.0 -0.5000000-000 0.0 Israel (Shekel) 3.8915 -0.0011 896-933 3.9035 3.8746 3.8914 0.0 3.8895 0.2 3.8741 0.4 Japan (Yen) 119.895 0.5200 880-910 119.930 119.220 119.864 0.3 119.792 0.3 119.174 0.6 90.7 Kuwait (Kuwaiti Dinar) 0.2929 0.0003 928-930 0.2930 0.2921 0.2930 -0.2 0.2931 -0.3 0.2940 -0.4 Malaysia (Ringgit) 3.4965 -0.0020 950-980 3.4980 3.4890 3.5052 3.0 3.5228 -3.0 3.5835 -2.4 New Zealand (NZ$) 1.2794 0.0051 791-798 0.7818 0.7814 1.2837 4.0 1.2909 3.5 1.3241 3.4 108.9 Philippines (Peso) 44.7325 250-400 44.7750 44.7250 44.8025 -1.9 44.9075 -1.6 45.3875 -1.4 Saudi Arabia (Riyal) 3.7525 -0.0002 522-527 3.7532 3.7515 3.7522 0.1 3.7522 0.0 3.7572 -0.1 Singapore 1.3251 0.0040 248-254 1.3254 1.3194 1.3262 -1.0 1.3270 -0.6 1.3290 -0.3 85.2 South Africa (Rand) 11.5688 0.0135 637-738 11.5962 11.5330 11.6259 -5.9 11.7457 -6.0 12.3182 -6.1 Korea South (Won) 1099.15 - 900-930 1099.30 1086.67 1100.95 -2.0 1103.70 -1.6 1109.95 -1.0 142.2 Taiwan ($) 31.6020 -0.1225 000-040 31.7200 31.5300 31.5980 0.2 31.5800 0.3 31.3660 0.8 Thailand (Baht) 32.9000 . 900-100 32.9700 32.8000 32.9538 2.0 33.0415 -1.7 33.3350 -1.3 JAE (Dirham) 3.6730 -0.0001 729-731 3.6730 3.6720 3.6729 0.0 3.6729 0.0 3.6743 0.0 (A$) * The closing mid-point rates for the Euro and are shown in brackets. The other figures in both rows are in the reciprocal form in line with market convention Official rates set by Malaysian Government. The WM/Reuters rate for the valuation of capital assets in 2.80 MYR/USD. Bid/offer spreads in the Dollar Spot table show only the last three decimal places. J.P. Morgan nominal indices: Base average 2000 = 100. Bid, offer, mid spot rates and forward rates in both this and the pound table are derived from the WM/Reuters 4pm (London time) CLOSING SPOT and FORWARD RATE services. Some values are rounded by the F.T