Answered step by step
Verified Expert Solution
Question
1 Approved Answer
Tableau DA 5 - 2 ( Algo ) : Exercise, Periodic: Inventory costing methods LO P 1 ATV Co . began March with NO INVENTORY
Tableau DA Algo: Exercise, Periodic: Inventory costing methods LO P
ATV Co began March with NO INVENTORY and uses a periodic inventory system. It entered into purchases and sales for March as shown in the Tableau Dashboard.
For March of Year compute the cost assigned to cost of goods sold and to ending inventory using FIFO.
For March of Year compute the cost assigned to cost of goods sold and to ending inventory using LIFO.
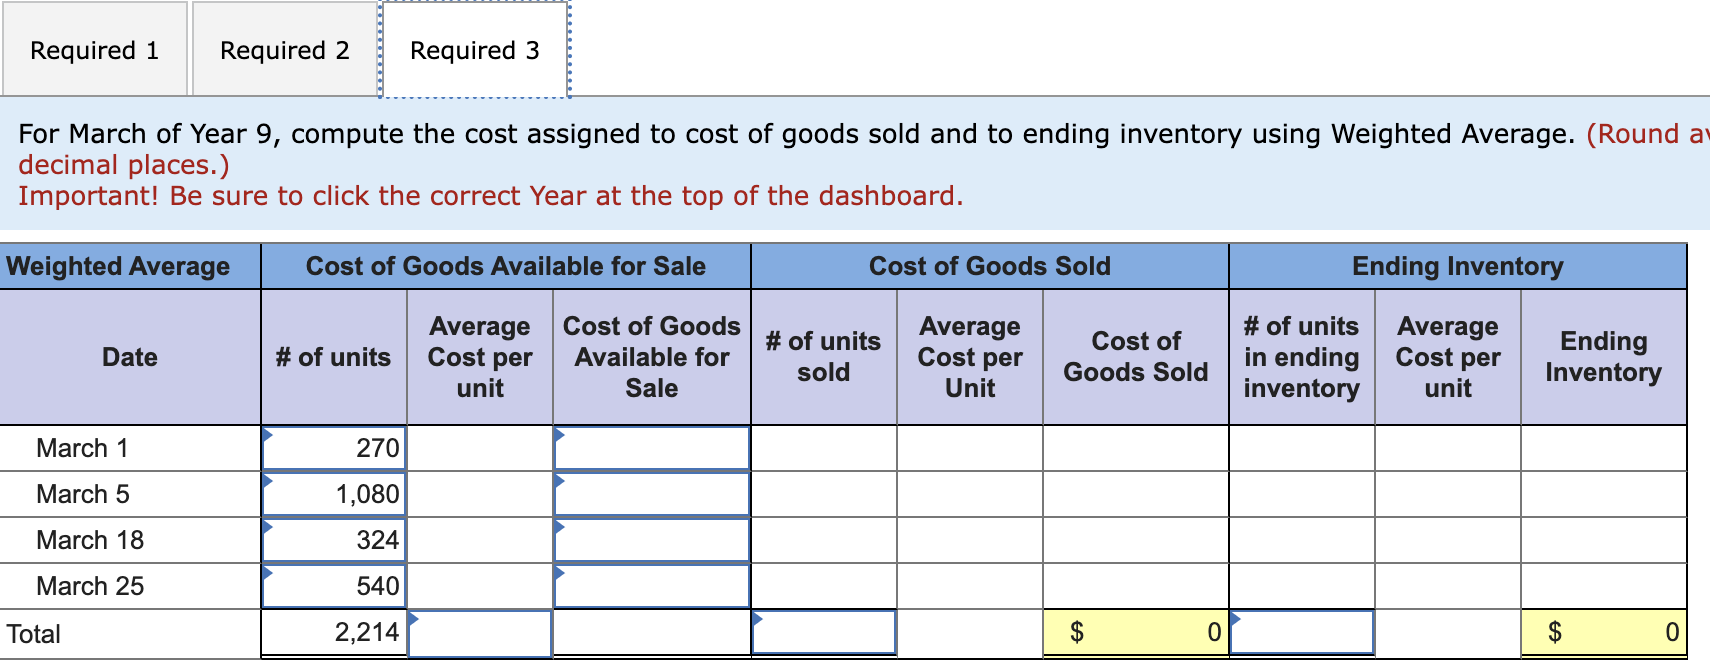
For March of Year compute the cost assigned to cost of goods sold and to ending inventory using Weighted Average. Round average cost per unit to decimal places.
Important! Be sure to click the correct Year at the top of the dashboard.
MARCH purchases Units @ $ each
MARCH purchases Units @ $ each
MARCH SOLD Units @ $ each
MARCH purchases Units @ $ each
MARCH purchases at $ each
MARCH SOLD Units at $ each
Complete this question by entering your answers in the tabs below.
Required
Required
Required
For March of Year compute the cost assigned to cost of goods sold and to ending inventory using FIFO.
Important! Be sure to click the correct Year at the top of the dashboard.
begintabularcccccccccccccccc
hline Periodic FIFO & multicolumnlCost of Goods Available for Sale & multicolumncCost of Goods Sold & multicolumncEnding Inventory
hline Date & # of units & multicolumnlCost per unit & multicolumnlCost of Goods Available for Sale & # of units sold & multicolumnlCost per unit & multicolumnlCost of Goods Sold & # of units in ending inventory & multicolumnlCost per unit & multicolumnrEnding Inventory
hline March & & $ & & $ & & & $ & & $ & & & & & $ &
hline March & & $ & & & & & & & & & & & & &
hline March & & $ & & & & & $ & & & & & $ & & &
hline March & & $ & & & & & $ & & & & & $ & & &
hline Total & & & & $ & & & & & $ & & & & & $ &
hline
endtabular Complete this question by entering your answers in the tabs below.
Required
Required
For March of Year compute the cost assigned to cost of goods sold and to ending inventory using LIFO.
Important! Be sure to click the correct Year at the top of the dashboard.
begintabularcccccccccccc
hline Periodic LIFO & multicolumnlCost of Goods Available for Sale & multicolumncCost of Goods Sold & multicolumncEnding Inventory
hline Date & # of units & & & & ost of oods able for Sale &
beginarrayl
text # of units
text sold
endarray
& Cost per unit & Cost of Goods Sold & # of units in ending inventory & Cost per unit & Ending Inventory
hline March & & $ & & & & & & & & &
hline March & & $ & & & & & & & & &
hline March & & $ & & & & & & & & &
hline March & & $ & & & & & & & & &
hline Total & & & & & & & & & & &
hline
endtabular Required
Required
Required
For March of Year compute the cost assigned to cost of goods sold and to ending inventory using Weighted Average. Round a decimal places.
Important! Be sure to click the correct Year at the top of the dashboard.
begintabularlrcccccccc
hline Weighted Average & multicolumnc Cost of Goods Available for Sale & multicolumnc Cost of Goods Sold & multicolumnc Ending Inventory
hline Date & # of units & begintabularc
Average
Cost per
unit
endtabular & begintabularc
Cost of Goods
Available for
Sale
endtabular & begintabularc
# of units
sold
endtabular & begintabularc
Average
Cost per
Unit
endtabular & begintabularc
Cost of
Goods Sold
endtabular & begintabularc
# of units
in ending
inventory
endtabular & begintabularc
Average
Cost per
unit
endtabular & begintabularc
Ending
Inventory
endtabular
hline March & & & & & & & &
hline March & & & & & & &
hline March & & & & & & &
hline March & & & & & & &
hline Total & & & & & $ & &
hline
endtabular

Step by Step Solution
There are 3 Steps involved in it
Step: 1

Get Instant Access to Expert-Tailored Solutions
See step-by-step solutions with expert insights and AI powered tools for academic success
Step: 2

Step: 3

Ace Your Homework with AI
Get the answers you need in no time with our AI-driven, step-by-step assistance
Get Started


