

Answered step by step
Verified Expert Solution
Question
1 Approved Answer
Tableau: PLEASE Choose QDEL, QSALE, QEMP, QDEPT, QSPL , and QITEM tables that are connected together and pertinent to your ASSIGNMENT 3 , ideas and
Tableau:
PLEASE Choose QDEL, QSALE, QEMP, QDEPT, QSPL and QITEM tables that are connected together and pertinent to your ASSIGNMENT ideas and creativity. YOU CAN ADD YOUR OWN DATA TO THE EXISTING DATA IN THE TABLES TO SUPPORT YOUR IDEAS IF YOU WANT AND IF YOU ARE ABLE.
Once data is available on Tableau, you are ready to go by using only Tableau for the rest of this assignment of data analytics.
You will use your data source on Tableau or your sheets on Tableau to complete the following tasks.
Please note the tasks:
On the data source or sheets on Tableau, you can create additional columns that are calculated columns; for instance: total sales, total cost, Gross Profit, employee salary raises for and more if you want.
Create at least eight sheets or views and rename them. Please rename the sheets based on your creativity or ideas. You will give a title to each view, dashboard, and story. The name you will give to the title must be different from the name you will give to the sheet, dashboard, and story.
Use the data pane and the analysis pane for your analysis.
Create at least three dashboards. Please reorganize your sheets as you want in your dashboards.
Create a story. An example of story can be: Overall, our profits look very low; lets focus on problem areas; our top suppliers are great; etc.
Add or create hierarchies that can be seen in your data.
Add or create groups that can be seen in your data.
Create calculations like ratios. For instance, Profitssales profit ratio, etc.
Use dashboard interactivity by adding URLs to your dashboards.
Use calculations by using formulas like if then else end, etc.
Problems
You must find problems based on your analytics. Specify clearly the problems. Write the problems you find and explain it at least quarter page for the problems
Solutions
You must propose solutions to the problems. Write clearly the solutions to each problem at least quarter page for the solutions
Recommendations
What do you recommend the company doesLacroix Products Database
The management of Lacroix Products, a distributor of clothes, helmet, and goods, has determined that the company's recent growth means that it is no longer feasible to maintain suppliers, deliveries, items departments and inventory data using its manual systems. By placing the data on a computer with a fullfeatured database management system, management will be able to ensure that the data is current and more accurate than in the present manual system. Management will also be able to provide a variety of useful analytics, intelligence, reports, dashboards and storytelling. In addition, management wants to be able to ask questions concerning the data in the database and obtain answers to these questions easily and quickly.
In deciding what data must be stored in the database, management has determined that Lacroix Products also must maintain the information about its employees, their salaries, and the floors where their departments operate. Finally, Lacroix Products must store information about sales.
You will use the following tables for this assignment of Tableau:
QDEL, QEMP, QSALES, QDEL, QSPL and QDEPT.
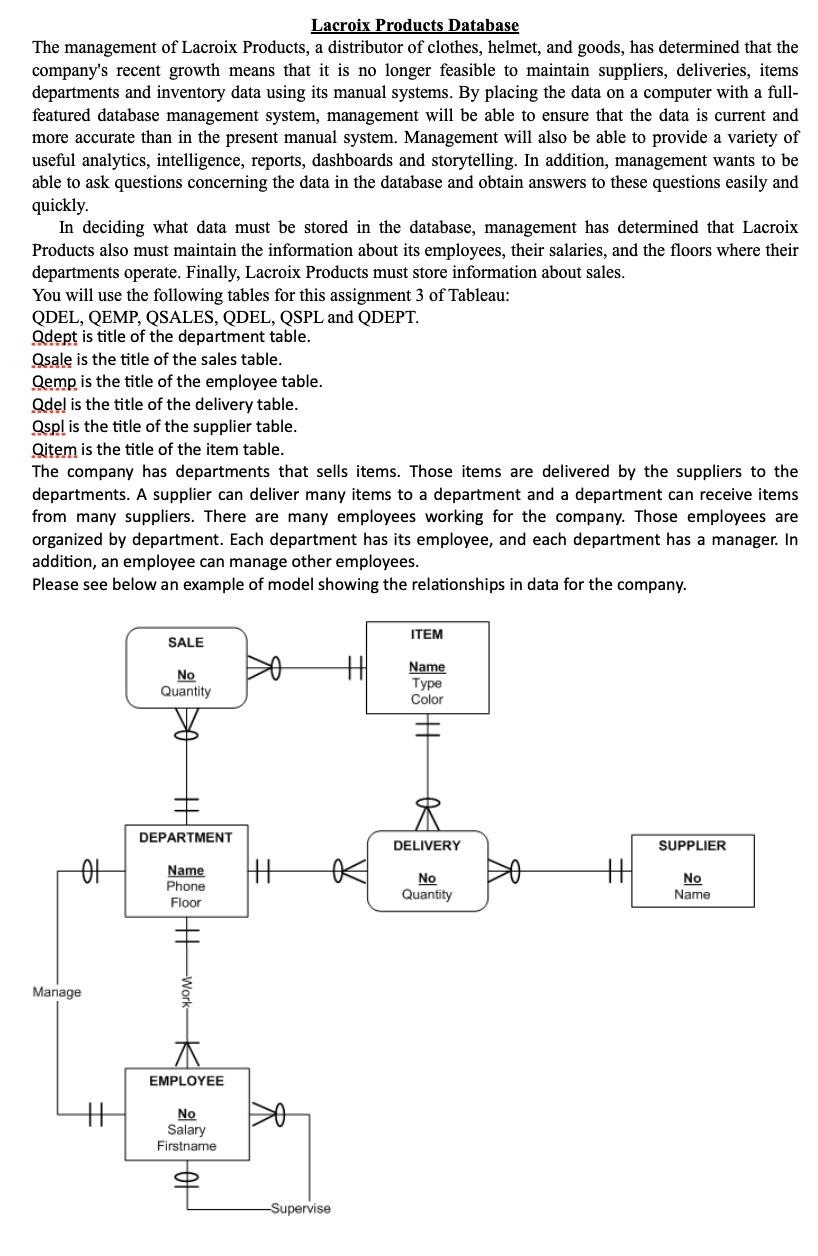
Qdept is title of the department table.
Qsale is the title of the sales table.
Qemp is the title of the employee table.
Qdel is the title of the delivery table.
Qspl is the title of the supplier table.
Qitem is the title of the item table.
The company has departments that sells items. Those items are delivered by the suppliers to the departments. A supplier can deliver many items to a department and a department can receive items from many suppliers. There are many employees working for the company. Those employees are organized by department. Each department has its employee, and each department has a manager. In addition, an employee can manage other employees.
Please see below an example of model showing the relationships in data for the company. to fix the problems you found? Write down clear and understandable recommendations to each problems and solution at least quarter page for the recommendations
Step by Step Solution
There are 3 Steps involved in it
Step: 1

Get Instant Access to Expert-Tailored Solutions
See step-by-step solutions with expert insights and AI powered tools for academic success
Step: 2

Step: 3
Ace Your Homework with AI
Get the answers you need in no time with our AI-driven, step-by-step assistance
Get Started
50 Tips And Tricks For MongoDB Developers Get The Most Out Of Your Database
Authors: Kristina Chodorow
1st Edition
1449304613, 978-1449304614