

Answered step by step
Verified Expert Solution
Question
1 Approved Answer
Tables 1 and 2 below contain the results of sampling a process. Each sample contains five items and is the result of measuring a
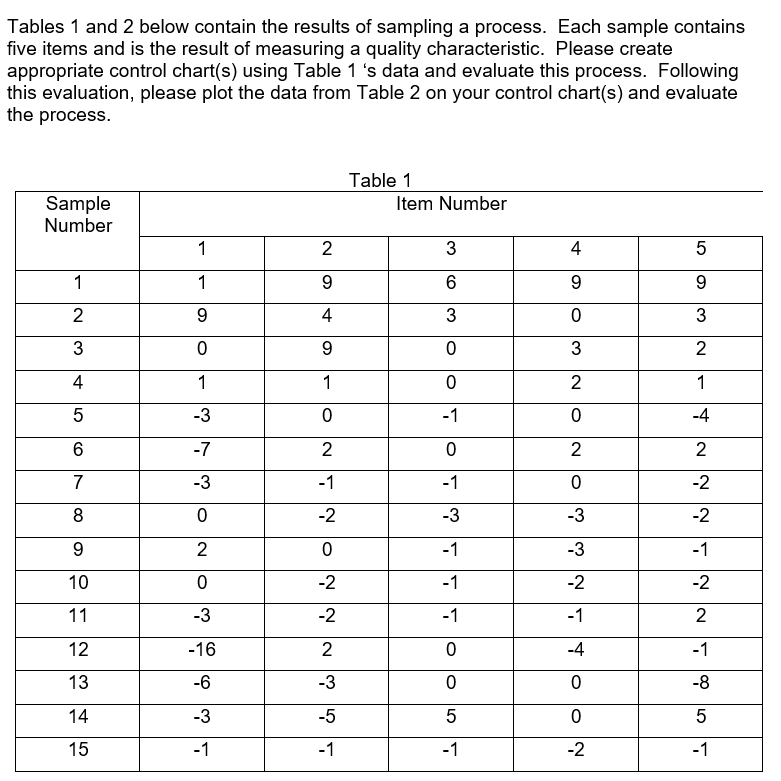
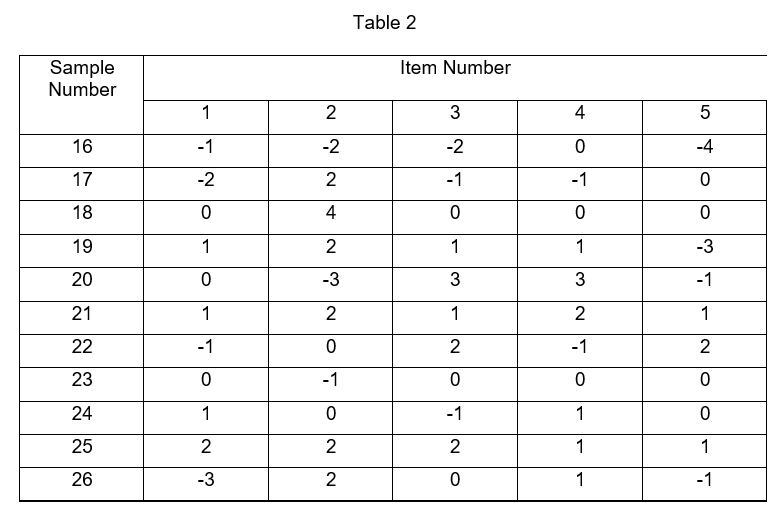
Tables 1 and 2 below contain the results of sampling a process. Each sample contains five items and is the result of measuring a quality characteristic. Please create appropriate control chart(s) using Table 1 's data and evaluate this process. Following this evaluation, please plot the data from Table 2 on your control chart(s) and evaluate the process. Sample Number 1 2 3 4 5 6 7 8 9 10 11 12 13 14 15 1 1 9 0 1 -3 -7 -3 0 2 0 -3 -16 -6 -3 -1 2 9 4 9 1 0 2 -1 -2 0 -2 -2 2 -3 -5 -1 Table 1 Item Number 3 6 3 0 0 -1 0 -1 -3 -1 -1 -1 0 0 5 -1 4 9 0 3 2 0 2 0 -3 -3 -2 -1 -4 0 0 -2 5 9 3 2 1 -4 2 -2 -2 -1 -2 2 -1 -8 5 -1 Sample Number 16 17 18 19 20 21 2222 23 24 25 26 1 -1 -2 0 1 0 1 -1 0 1 2 -3 2 -2 2 4 2 -3 2 0 -1 0 2 2 Table 2 Item Number 3 -2 -1 0 1 3 1 2 0 -1 2 0 0 -1 0 3 2 -1 0 1 1 1 5 -4 0 0 -3 -1 1 2 0 0 1 -1
Step by Step Solution
★★★★★
3.43 Rating (150 Votes )
There are 3 Steps involved in it
Step: 1
You have provided two tables containing data from a sampling process with the request to create control charts and evaluate the process based on the data from Table 1 and subsequently from Table 2 To ...
Get Instant Access to Expert-Tailored Solutions
See step-by-step solutions with expert insights and AI powered tools for academic success
Step: 2

Step: 3
Ace Your Homework with AI
Get the answers you need in no time with our AI-driven, step-by-step assistance
Get Started
Auditing Cases An Interactive Learning Approach
Authors: Mark S Beasley, Frank A. Buckless, Steven M. Glover, Douglas F Prawitt
7th Edition
0134421825, 9780134421827