Tables:
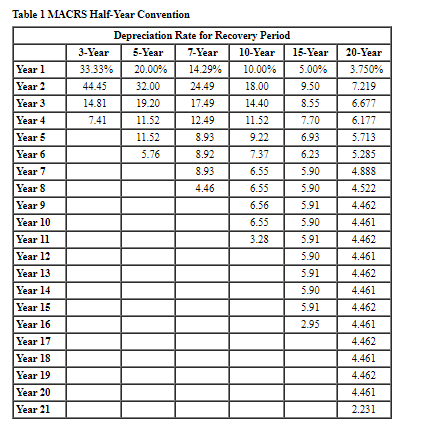
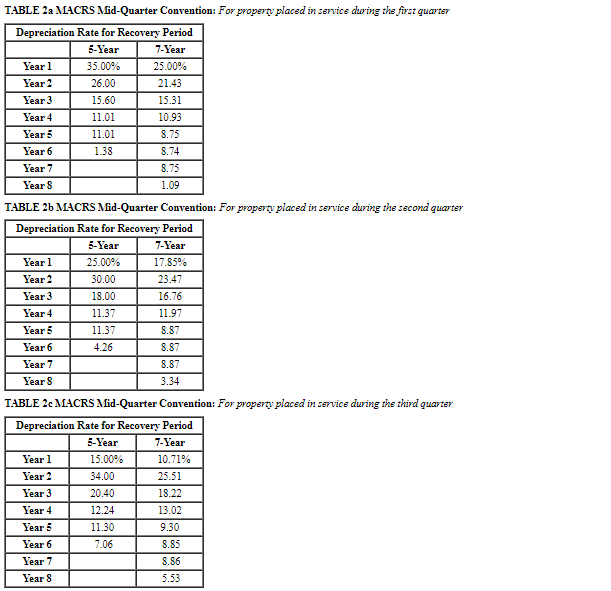
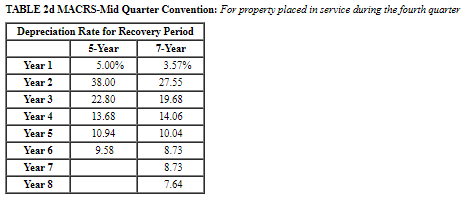
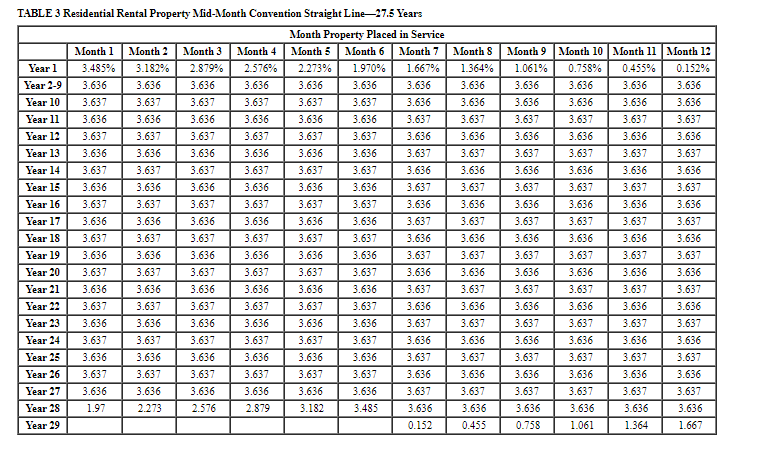
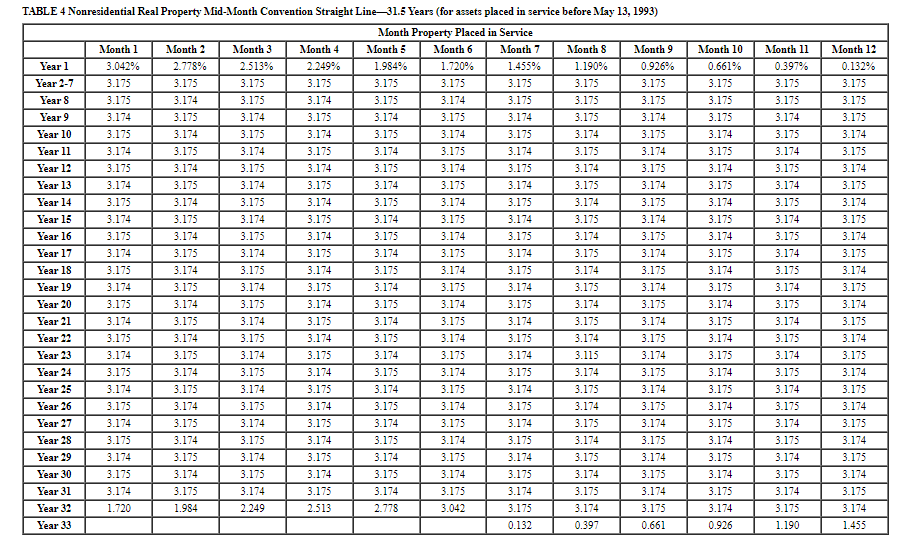
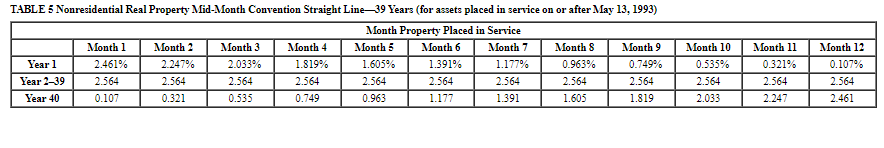
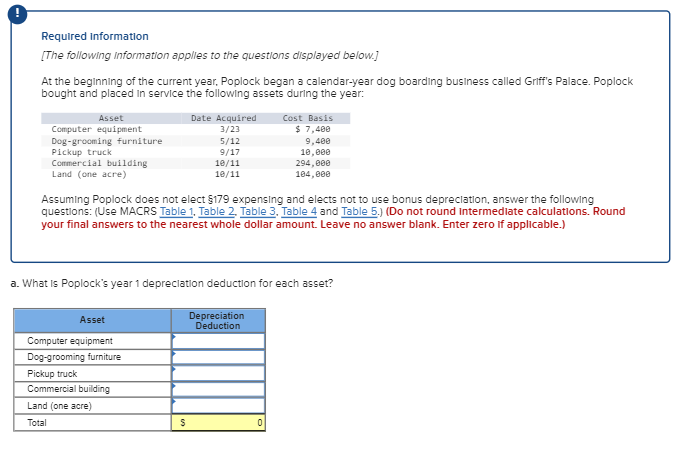
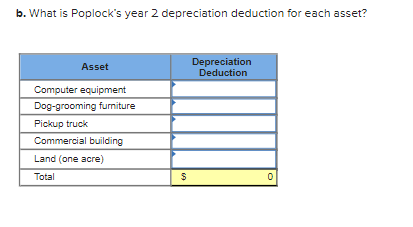
Required Information [The following information applies to the questions displayed below.] At the beginning of the current year, Poplock began a calendar-year dog boarding business called Griff's Palace. Poplock bought and placed in service the following assets during the year: Asset Computer equipment Dog-grooming furniture Pickup truck Commercial building Land (one acre) Date Acquired 3/23 5/12 9/17 10/11 10/11 Asset Computer equipment Dog-grooming furniture Pickup truck Commercial building Land (one acre) Total Assuming Poplock does not elect $179 expensing and elects not to use bonus depreciation, answer the following questions: (Use MACRS Table 1, Table 2, Table 3, Table 4 and Table 5.) (Do not round Intermediate calculations. Round your final answers to the nearest whole dollar amount. Leave no answer blank. Enter zero if applicable.) S a. What is Poplock's year 1 depreciation deduction for each asset? Cost Basis $ 7,400 9,400 10,000 Depreciation Deduction 294,000 104,000 0 b. What is Poplock's year 2 depreciation deduction for each asset? Asset Computer equipment Dog-grooming furniture Pickup truck Commercial building Land (one acre) Total $ Depreciation Deduction 0 Table 1 MACRS Half-Year Convention Year 1 Year 2 Year 3 Year 4 Year 5 Year 6 Year 7 Year 8 Year 9 Year 10 Year 11 Year 12 Year 13 Year 14 Year 15 Year 16 Year 17 Year 18 Year 19 Year 20 Year 21 Depreciation Rate for Recovery Period 3-Year 5-Year 7-Year 10-Year 15-Year 20.00% 14.29% 10.00% 5.00% 32.00 18.00 9.50 19.20 14.40 8.55 11.52 7.70 9.22 6.93 6.23 5.90 5.90 5.91 5.90 5.91 5.90 5.91 5.90 5.91 2.95 33.33% 44.45 14.81 7.41 11.52 11.52 5.76 24.49 17.49 12.49 8.93 8.92 8.93 4.46 7.37 6.55 6.55 6.56 6.55 3.28 20-Year 3.750% 7.219 6.677 6.177 5.713 5.285 4.888 4.522 4.462 4.461 4.462 4.461 4.462 4.461 4.462 4.461 4.462 4.461 4.462 4.461 2.231 TABLE 2a MACRS Mid-Quarter Convention: For property placed in service during the first quarter Depreciation Rate for Recovery Period 5-Year 7-Year 35.00% 25.00% 26.00 21.43 15.60 15.31 11.01 10.93 11.01 8.75 1.38 8.74 8.75 1.09 Year 1 Year 2 Year 3 Year 4 Year 5 Year 6 Year 7 Year 8 TABLE 26 MACRS Mid-Quarter Convention: For property placed in service during the second quarter Depreciation Rate for Recovery Period 5-Year 7-Year 25.00% 17.85% 30.00 23.47 18.00 11.37 11.37 4.26 Year 1 Year 2 Year 3 Year 4 Year 5 Year 6 Year 7 Year 8 16.76 11.97 8.87 8.87 8.87 3.34 TABLE 2c MACRS Mid-Quarter Convention: For property placed in service during the third quarter Depreciation Rate for Recovery Period 5-Year 7-Year 15.00% 10.71% 34.00 25.51 20.40 18.22 12.24 13.02 11.30 7.06 Year 1 Year 2 Year 3 Year 4 Year 5 Year 6 Year 7 Year 8 9.30 8.85 8.86 5.53 TABLE 2d MACRS-Mid Quarter Convention: For property placed in service during the fourth quarter Depreciation Rate for Recovery Period 5-Year 7-Year Year 1 Year 2 Year 3 Year 4 Year 5 Year 6 Year 7 Year 8 5.00% 38.00 22.80 13.68 10.94 9.58 3.57% 27.55 19.68 14.06 10.04 8.73 8.73 7.64 TABLE 3 Residential Rental Property Mid-Month Convention Straight Line-27.5 Years Month Property Placed in Service Month 6 Month 7 Month 5 Year 1 Year 2-9 Year 10 Year 11 Year 12 Year 13 Year 14 Year 15 Year 16 Year 17 Year 18 Year 19 Year 20 Year 21 Year 22 Year 23 Year 24 Year 25 Year 26 Year 27 Year 28 Year 29 Month 1 Month 2 3.485% 3.182% 3.636 3.636 3.637 3.636 3.637 3.636 3.637 3.636 3.637 3.636 3.637 3.636 3.637 3.636 3.637 3.636 3.637 3.636 3.637 3.636 1.97 3.637 3.636 3.637 3.636 3.637 3.636 3.637 3.636 3.637 3.636 3.637 3.636 3.637 3.636 3.637 3.636 3.637 3.636 2.273 Month 3 2.879% 3.636 3.637 3.636 3.637 3.636 3.637 3.636 3.637 3.636 3.637 3.636 3.637 3.636 3.637 3.636 3.637 3.636 3.637 3.636 2.576 Month 4 2.576% 3.636 3.637 3.636 3.637 3.636 3.637 3.636 3.637 2.273% 3.636 3.637 3.636 3.637 3.636 3.637 3.637 3.636 3.637 3.636 2.879 1.970% 3.636 3.637 3.636 3.637 3.636 3.637 3.636 3.637 3.636 3.636 3.637 3.637 3.636 3.636 3.637 3.637 3.636 3.636 3.636 3.637 3.637 3.637 3.636 3.636 3.636 3.637 3.636 3.637 3.636 3.182 1.667% 3.636 3.636 3.637 3.636 3.637 3.637 3.636 3.636 3.636 3.637 3.637 3.637 3.636 3.636 3.636 3.637 3.637 3.637 3.636 3.636 3.636 3.637 3.637 3.637 3.636 3.636 3.637 3.637 3.636 3.637 3.637 3.636 3.636 3.637 3.637 3.636 3.636 3.485 Month 8 Month 9 Month 10 Month 11 Month 12 1.364% 1.061% 0.758% 0.455% 0.152% 3.636 3.636 3.636 3.636 3.636 3.636 3.636 3.636 3.636 3.636 3.637 3.637 3.637 3.637 3.636 3.636 3.636 3.637 3.637 3.637 3.636 3.636 3.636 3.636 3.637 3.637 3.637 3.637 3.636 3.636 3.636 3.636 3.637 3.637 3.637 3.637 3.636 3.636 3.636 3.637 3.637 3.637 3.636 3.636 3.636 3.637 3.637 3.637 3.636 3.636 3.636 3.636 3.637 3.637 3.637 3.636 3.636 3.637 3.636 0.152 3.637 3.636 3.636 3.637 3.637 3.636 3.637 3.637 3.636 3.636 3.637 3.636 0.758 3.637 3.636 0.455 3.637 3.636 3.637 3.636 1.061 3.636 3.637 3.636 3.637 3.636 1.364 3.636 3.637 3.636 3.637 3.636 3.637 3.636 3.637 3.636 3.637 3.636 1.667 TABLE 4 Nonresidential Real Property Mid-Month Convention Straight Line-31.5 Years (for assets placed in service before May 13, 1993) Month Property Placed in Service Month 6 Month 5 1.984% Month 7 1.455% 3.175 3.175 3.175 3.175 3.174 3.174 3.175 3.175 3.174 3.174 3.175 3.175 3.174 3.174 3.175 3.175 3.174 3.174 Year 1 Year 2-7 Year 8 Year 9 Year 10 Year 11 Year 12 Year 13 Year 14 Year 15 Year 16 Year 17 Year 18 Year 19 Year 20 Year 21 Year 22 Year 23 Year 24 Year 25 Year 26 Year 27 Year 28 Year 29 Year 30 Year 31 Year 32 Year 33 Month 1 3.042% 3.175 3.175 3.174 3.175 3.174 3.175 3.174 3.175 3.174 3.175 3.174 3.175 3.174 3.175 3.174 3.175 3.174 3.175 3.174 3.175 3.174 3.175 3.174 3.175 3.174 1.720 Month 2 2.778% 3.175 3.174 3.175 3.174 3.175 3.174 3.175 3.174 3.175 3.174 3.175 3.174 3.175 3.174 3.175 3.174 3.175 3.174 3.175 3.174 3.175 3.174 3.175 3.174 3.175 1.984 Month 3 2.513% 3.175 3.175 3.174 3.175 3.174 3.175 3.174 3.175 3.174 3.175 3.174 3.175 3.174 3.175 3.174 3.175 3.174 3.175 3.174 3.175 3.174 3.175 3.174 3.175 3.174 2.249 Month 4 2.249% 3.175 3.174 3.175 3.174 3.175 3.174 3.175 3.174 3.175 3.174 3.175 3.174 3.175 3.174 3.175 3.174 3.175 3.174 3.175 3.174 3.175 3.174 3.175 3.174 3.175 2.513 3.175 3.174 3.175 3.174 3.175 3.174 3.175 3.174 3.175 3.174 3.175 3.174 3.175 3.174 3.175 3.174 2.778 1.720% 3.175 3.174 3.175 3.174 3.175 3.174 3.175 3.174 3.175 3.174 3.175 3.174 3.175 3.174 3.175 3.174 3.175 3.174 3.175 3.174 3.175 3.174 3.175 3.174 3.175 3.042 3.175 3.174 3.175 3.174 3.175 3.174 3.175 3.174 3.175 3.174 3.175 3.174 3.175 3.174 3.175 3.174 3.175 0.132 Month 8 Month 9 1.190% 0.926% 3.175 3.175 3.175 3.175 3.174 3.175 3.174 3.175 3.174 3.175 3.174 3.175 3.174 3.175 3.174 3.175 3.174 3.115 3.174 3.175 3.174 3.175 3.174 3.175 3.174 3.175 3.174 0.397 3.175 3.174 3.175 3.174 3.175 3.174 3.175 3.174 3.175 3.174 3.175 3.174 3.175 3.174 3.175 3.174 3.175 3.174 3.175 3.174 3.175 3.174 3.175 3.174 3.175 0.661 Month 10 Month 11 0.661% 0.397% 3.175 3.175 3.175 3.175 3.175 3.174 3.174 3.175 3.175 3.174 3.174 3.175 3.174 3.175 3.174 3.175 3.174 3.175 3.174 3.175 3.174 3.175 3.174 3.175 3.174 3.175 3.174 3.175 3.174 3.175 3.174 0.926 3.175 3.174 3.175 3.174 3.175 3.174 3.175 3.174 3.175 3.174 3.175 3.174 3.175 3.174 3.175 3.174 3.175 3.174 3.175 3.174 3.175 1.190 Month 12 0.132% 3.175 3.175 3.175 3.174 3.175 3.174 3.175 3.174 3.175 3.174 3.175 3.174 3.175 3.174 3.175 3.174 3.175 3.174 3.175 3.174 3.175 3.174 3.175 3.174 3.175 3.174 1.455 TABLE 5 Nonresidential Real Property Mid-Month Convention Straight Line-39 Years (for assets placed in service on or after May 13, 1993) Month Property Placed in Service Month 5 1.605% Month 6 1.391% Month 7 1.177% 2.564 2.564 2.564 0.963 1.177 1.391 Year 1 Year 2-39 Year 40 Month 1 2.461% 2.564 0.107 Month 2 2.247% 2.564 0.321 Month 3 2.033% 2.564 0.535 Month 4 1.819% 2.564 0.749 Month 8 0.963% 2.564 1.605 Month 9 0.749% 2.564 1.819 Month 10 0.535% 2.564 2.033 Month 11 0.321% 2.564 2.247 Month 12 0.107% 2.564 2.461