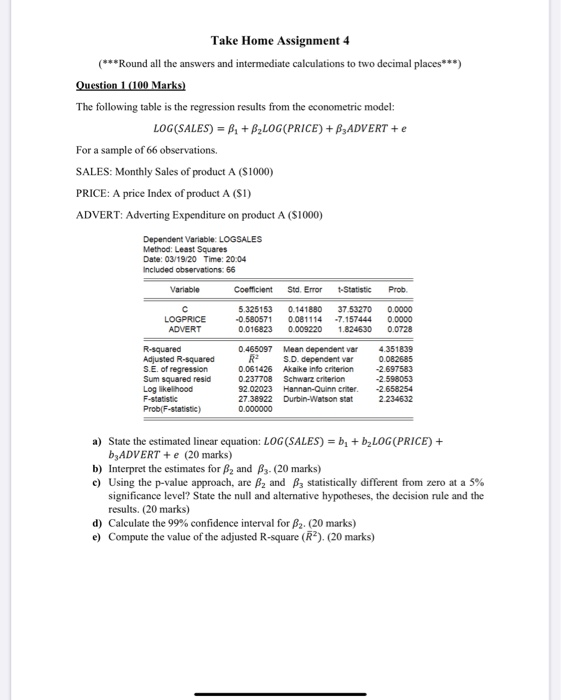
Take Home Assignment 4 (***Round all the answers and intermediate calculations to two decimal places**) Question 1 (100 Marks) The following table is the regression results from the econometric model: LOG(SALES) = B. + B, LOG(PRICE) + B3ADVERT + e For a sample of 66 observations. SALES: Monthly Sales of product A ($1000) PRICE: A price Index of product A (SI) ADVERT: Adverting Expenditure on product A (S1000) Dependent Variable: LOGSALES Method: Least Squares Date:03/19/20 Time: 20.04 Included observations: 66 Variable Coefficient Std. Error -Statistic Prob. LOGPRICE ADVERT 5.325153 -0.580571 0.016823 014188037 53270 0081114 -7.157444 0.009220 1.824630 0.0000 0.0000 0.0728 R-squared Adjusted R-squared S.E. of regression Sum squared resid Log likelihood F-statistic Prob(F-statistic) 0.465097 Mean dependent var R2 S.D. dependent var 0.061426 Akalke into criterion 0.237708 Schwarz criterion 92 02023 Hannan-Quinn criter. 27.38922 Durbin-Watson stat 0.000000 4.351839 0.082685 -2.697583 -2.598053 -2.658254 2.234632 a) State the estimated linear equation: LOG(SALES) = b; + b2LOG (PRICE) + bzADVERT + e (20 marks) b) Interpret the estimates for B2 and B3. (20 marks) c) Using the p-value approach, are B2 and Bz statistically different from zero at a 5% significance level? State the null and alternative hypotheses, the decision rule and the results. (20 marks) d) Calculate the 99% confidence interval for B. (20 marks) e) Compute the value of the adjusted R-square (R). (20 marks) Take Home Assignment 4 (***Round all the answers and intermediate calculations to two decimal places**) Question 1 (100 Marks) The following table is the regression results from the econometric model: LOG(SALES) = B. + B, LOG(PRICE) + B3ADVERT + e For a sample of 66 observations. SALES: Monthly Sales of product A ($1000) PRICE: A price Index of product A (SI) ADVERT: Adverting Expenditure on product A (S1000) Dependent Variable: LOGSALES Method: Least Squares Date:03/19/20 Time: 20.04 Included observations: 66 Variable Coefficient Std. Error -Statistic Prob. LOGPRICE ADVERT 5.325153 -0.580571 0.016823 014188037 53270 0081114 -7.157444 0.009220 1.824630 0.0000 0.0000 0.0728 R-squared Adjusted R-squared S.E. of regression Sum squared resid Log likelihood F-statistic Prob(F-statistic) 0.465097 Mean dependent var R2 S.D. dependent var 0.061426 Akalke into criterion 0.237708 Schwarz criterion 92 02023 Hannan-Quinn criter. 27.38922 Durbin-Watson stat 0.000000 4.351839 0.082685 -2.697583 -2.598053 -2.658254 2.234632 a) State the estimated linear equation: LOG(SALES) = b; + b2LOG (PRICE) + bzADVERT + e (20 marks) b) Interpret the estimates for B2 and B3. (20 marks) c) Using the p-value approach, are B2 and Bz statistically different from zero at a 5% significance level? State the null and alternative hypotheses, the decision rule and the results. (20 marks) d) Calculate the 99% confidence interval for B. (20 marks) e) Compute the value of the adjusted R-square (R). (20 marks)


