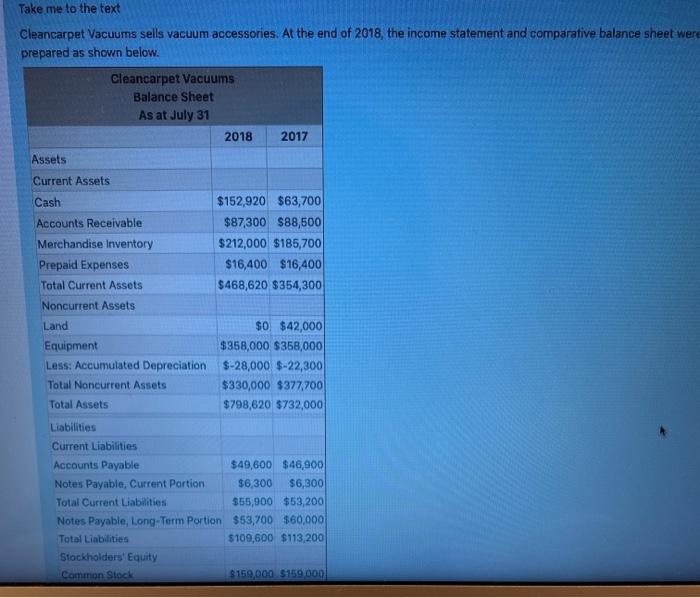
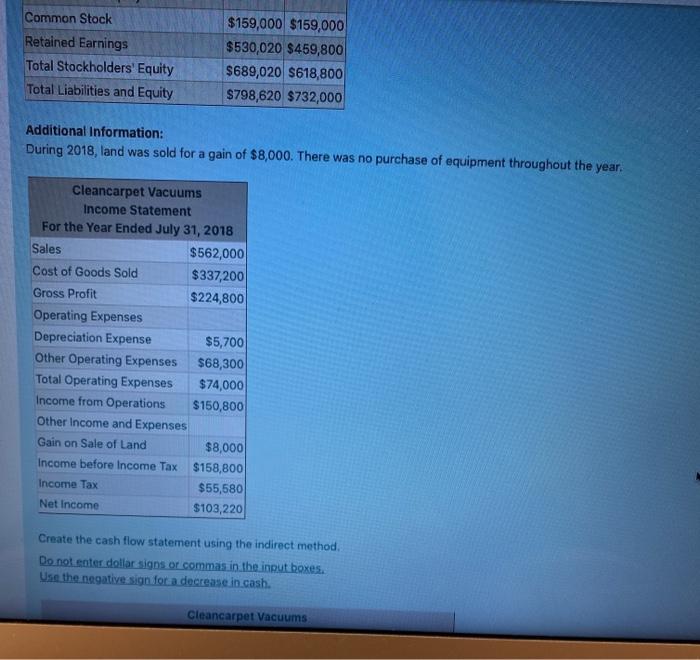
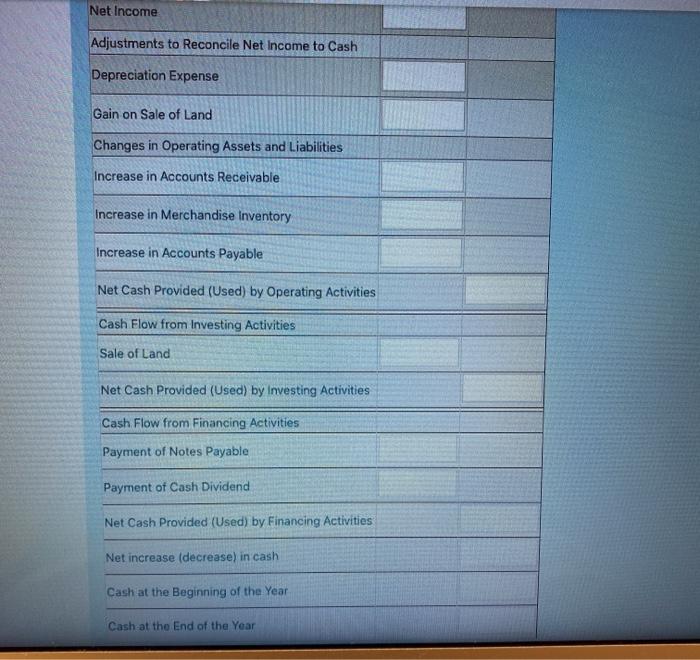
Take me to the text Cleancarpet Vacuums sells vacuum accessories. At the end of 2018, the income statement and comparative balance sheet were prepared as shown below. Cleancarpet Vacuums Balance Sheet As at July 31 2018 2017 Assets Current Assets Cash $152,920 $63,700 Accounts Receivable $87,300 $88,500 Merchandise Inventory $212,000 $185,700 Prepaid Expenses $16,400 $16,400 Total Current Assets $468,620 $354,300 Noncurrent Assets Land $0 $42,000 Equipment $358,000 $358,000 Less: Accumulated Depreciation $-28,000 $-22,300 Total Noncurrent Assets $330,000 $377,700 Total Assets $798,620 $732,000 Liabilities Current Liabilities Accounts Payable $49,600 $46,900 Notes Payable, Current Portion $6,300 $6,300 Total Current Liabilities $55,900 $53,200 Notes Payable, Long-Term Portion $53,700 $60,000 Total Liabilities $109,600 $113,200 Stockholders' Equity Common Stock $159,000 $159,000 Common Stock Retained Earnings Total Stockholders' Equity Total Liabilities and Equity $159,000 $159,000 $530,020 $459,800 $689,020 $618,800 $798,620 $732,000 Additional Information: During 2018, land was sold for a gain of $8,000. There was no purchase of equipment throughout the year. Cleancarpet Vacuums Income Statement For the Year Ended July 31, 2018 Sales $562,000 Cost of Goods Sold $337,200 Gross Profit $224,800 Operating Expenses Depreciation Expense $5,700 Other Operating Expenses $68,300 Total Operating Expenses $74,000 Income from Operations $150,800 Other Income and Expenses Gain on Sale of Land $8,000 Income before Income Tax S158,800 Income Tax $55,580 Net Income $103,220 Create the cash flow statement using the indirect method. Do not enter dollar signs or commas in the input boxes. Use the negative sign for a decrease in cash. Cleancarpet Vacuums Net Income Adjustments to Reconcile Net Income to Cash Depreciation Expense Gain on Sale of Land Changes in Operating Assets and Liabilities Increase in Accounts Receivable Increase in Merchandise Inventory Increase in Accounts Payable Net Cash Provided (Used) by Operating Activities Cash Flow from Investing Activities Sale of Land Net Cash Provided (Used) by Investing Activities Cash Flow from Financing Activities Payment of Notes Payable Payment of Cash Dividend Net Cash Provided (Used) by Financing Activities Net increase (decrease) in cash Cash at the Beginning of the Year Cash at the End of the Year


