Take the FY2019(March31,2019)
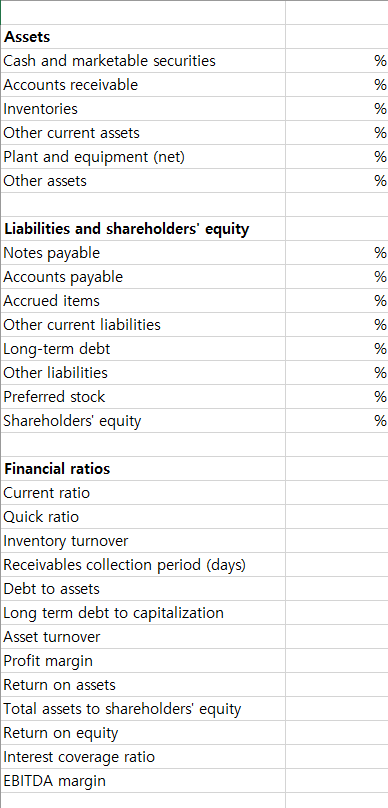
Calculate B/S P/L percentages/ratios
Rounding, the number of figures below decimal point
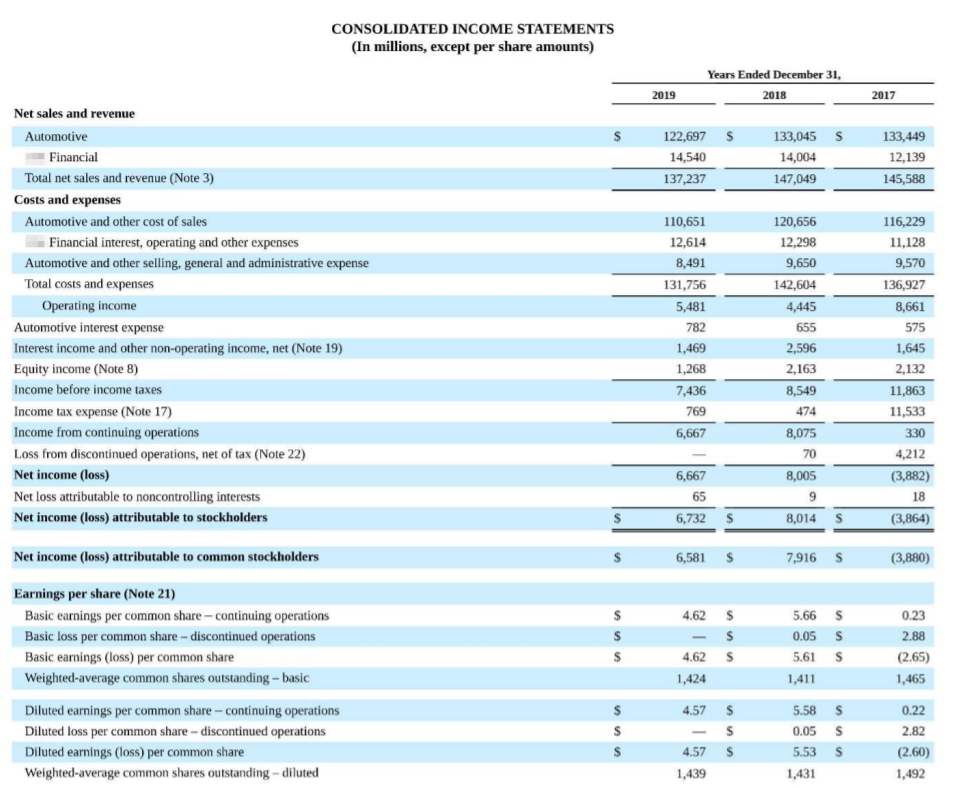
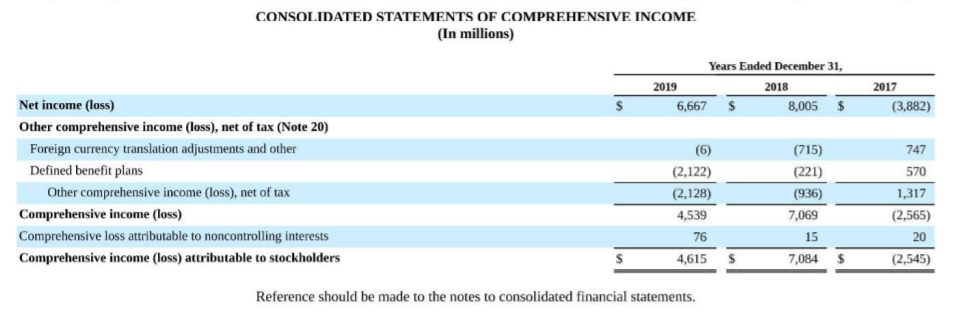
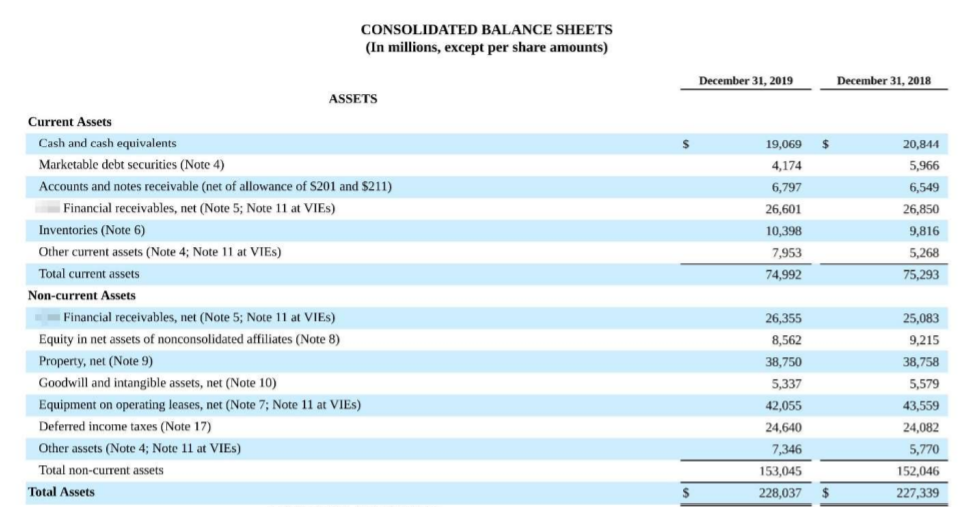
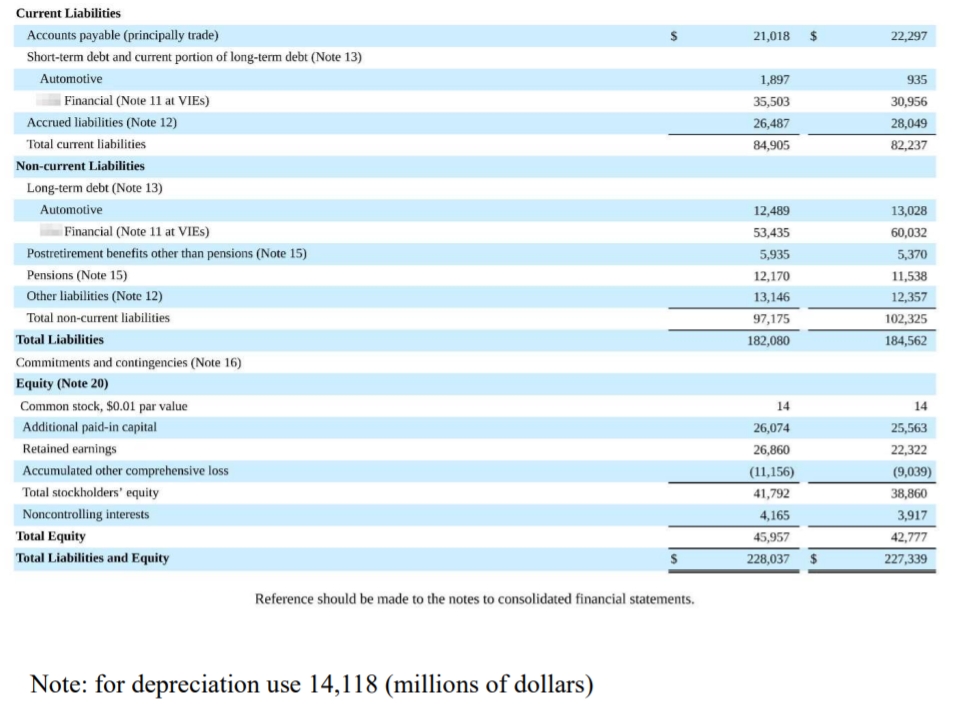
CONSOLIDATED INCOME STATEMENTS (In millions, except per share amounts) Years Ended December 31, 2019 2018 2017 S 122,697 $ 14,540 137,237 133,045 S 14,004 147,049 133,449 12,139 145,588 110,651 12,614 8,491 Net sales and revenue Automotive Financial Total net sales and revenue (Note 3) Costs and expenses Automotive and other cost of sales Financial interest, operating and other expenses Automotive and other selling, general and administrative expense Total costs and expenses Operating income Automotive interest expense Interest income and other non-operating income, net (Note 19) Equity income (Note 8) Income before income taxes Income tax expense (Note 17) Income from continuing operations Loss from discontinued operations, net of tax (Note 22) Net income (loss) Net loss attributable to noncontrolling interests Net income (loss) attributable to stockholders 131,756 5,481 782 1,469 1,268 7,436 769 120,656 12,298 9,650 142,604 4,445 655 2.596 116,229 11,128 9,570 136,927 8,661 575 1,645 2,132 11,863 11,533 2,163 8,549 474 6,667 330 8,075 70 4,212 8,005 6,667 65 6,732 $ 9 9 (3,882) 18 (3,864) S 8,014 S Net income (loss) attributable to common stockholders S 6,581 $ 7,916 S (3,880) 0.23 Earnings per share (Note 21) Basic earnings per common share - continuing operations Basic loss per common share - discontinued operations Basic earnings (loss) per common share Weighted average common shares outstanding - basic $ $ 4.625 $ 4.62 $ 1,424 5.66 S 0.05 S 5.61 S 1,411 S 2.88 (2.65) ( 1,465 S 0.22 4.57 $ $ Diluted earnings per common share - continuing operations Diluted loss per common share - discontinued operations Diluted earnings (loss) per common share Weighted average common shares outstanding - diluted $ $ 5.58 S 0.05 S 5.53 $ 1,431 4.57 $ 2.82 (2.60) 1,492 1,439 CONSOLIDATED STATEMENTS OF COMPREHENSIVE INCOME (In millions) Years Ended December 31, 2019 2018 6,667 $ 8,005 $ 2017 (3,882) 747 Net income (loss) Other comprehensive income (loss), net of tax (Note 20) Foreign currency translation adjustments and other Defined benefit plans Other comprehensive income (loss), net of tax Comprehensive income (loss) Comprehensive loss attributable to noncontrolling interests Comprehensive income (loss) attributable to stockholders (6) (2,122) (2,128) 4,539 76 4,615 (715) (221) (936) 7,069 15 7,084 $ 570 1,317 (2,565) 20 (2,545) $ Reference should be made to the notes to consolidated financial statements. CONSOLIDATED BALANCE SHEETS (In millions, except per share amounts) December 31, 2019 December 31, 2018 ASSETS $ 19,069 4,174 20,814 5,966 6,797 26,601 10,398 6,549 26,850 9,816 5,268 75,293 7,953 74,992 Current Assets Cash and cash equivalents Marketable debt securities (Note 4) Accounts and notes receivable (net of allowance of S201 and $211) Financial receivables, net (Note 5; Note 11 at VIES) Inventories (Note 6) Other current assets (Note 4; Note 11 at VIES) Total current assets Non-current Assets Financial receivables, net (Note 5; Note 11 at VIES) Equity in net assets of nonconsolidated affiliates (Note 8) Property, net (Note 9) Goodwill and intangible assets, net (Note 10) Equipment on operating leases, net (Note 7; Note 11 at VIES) Deferred income taxes (Note 17) Other assets (Note 4; Note 11 at VIES) Total non-current assets Total Assets 26,355 8,562 38,750 5,337 42,055 25,083 9.215 38,758 5,579 43,559 24,640 7,346 153,045 228,037 24,082 5,770 152,046 227,339 $ 21,018 $ 22,297 1,897 35,503 26,487 935 30,956 28,049 84,905 82.237 13,028 12,489 53,435 5.935 60,032 5,370 Current Liabilities Accounts payable (principally trade) Short-term debt and current portion of long-term debt (Note 13) Automotive Financial (Note 11 at VIES) Accrued liabilities (Note 12) Total current liabilities Non-current Liabilities Long-term debt (Note 13) Automotive Financial (Note 11 at VIES) Postretirement benefits other than pensions (Note 15) Pensions (Note 15) Other liabilities (Note 12) Total non-current liabilities Total Liabilities Commitments and contingencies (Note 16) Equity (Note 20) Common stock, $0.01 par value Additional paid-in capital Retained earnings Accumulated other comprehensive loss Total stockholders' equity Noncontrolling interests Total Equity Total Liabilities and Equity 12,170 13,146 97,175 11,538 12,357 102,325 182,080 184,562 14 14 26,074 26,860 (11,156) 41,792 4,165 45,957 25,563 22,322 (9,039) 38,860 3,917 Water 42,777 228,037 227,339 Reference should be made to the notes to consolidated financial statements. Note: for depreciation use 14,118 (millions of dollars) Assets Cash and marketable securities Accounts receivable Inventories Other current assets Plant and equipment (net) Other assets % % % % % % Liabilities and shareholders' equity Notes payable Accounts payable Accrued items Other current liabilities Long-term debt Other liabilities Preferred stock Shareholders' equity % % % % % % % % Financial ratios Current ratio Quick ratio Inventory turnover Receivables collection period (days) Debt to assets Long term debt to capitalization Asset turnover Profit margin Return on assets Total assets to shareholders' equity Return on equity Interest coverage ratio EBITDA margin