Take-home assignment #2:
Pro forma statements and company valuation
Island Beverage Co. is considering a capacity expansion in 2022 to meet the growing demand for its coffee products. If the company undertakes the project, the improved production capacity will help increase the company's market share from the current 2021 share of 10% by 1% each year in 2022, 2023, and again in 2024. If the company decides not to expand its capacity, then its market share will grow only by 0.5% each year during the three-year period. The project, should the company take it, will increase the company's capital expenditures by $70 million in 2022. To finance the project, the company plans to raise $70 million in 2022 through a long-term bank loan at 10% annual interest. Additionally, the company's management makes the following assumptions for each scenario:
| | Scenario 1: Expansion | Scenario 2: No expansion |
| Market size growth (%) | 3% per year (compound) | Same as scenario 1 |
| Market share growth (%) | 1% per year (simple) | 0.5% per year |
| On-going capital expenditures | Annual expenditures for replacement of old parts. $8 million until 2022, then $10 million from 2022 | Annual expenditures of $8 million for replacement of old parts |
| Capital expenditures for expansion | one-time expenditure of $70 million in 2022 | None ($0) |
| Depreciation | 10% of the sum of opening book value and capital expenditures | Same as scenario 1 |
| Existing debt | $50 million outstanding long-term debt | Same as scenario 1 |
| Project financing | $70 million additional long-term bank loan in 2022 | None ($0) |
| Interest rate | 10% | Same as scenario 1 |
| Costs Except Depreciation | Percent-of-sales | Same as scenario 1 |
| Corporate income tax | 30% | Same as scenario 1 |
| Cash and Cash Equivalents | Percent-of-sales | Same as scenario 1 |
| Accounts Receivable | Percent-of-sales | Same as scenario 1 |
| Inventories | Percent-of-sales | Same as scenario 1 |
| Accounts Payable | Percent-of-sales | Same as scenario 1 |
| Industry EV / EBITDA | 5 | Same as scenario 1 |
| Discount rate | 16% | Same as scenario 1 |
| Excess capital (if any) | Assumed to be paid out in full as dividends | Same as scenario 1 |
| Capital shortfall (if any) | Borrow from the local bank via term loan | Same as scenario 1 |
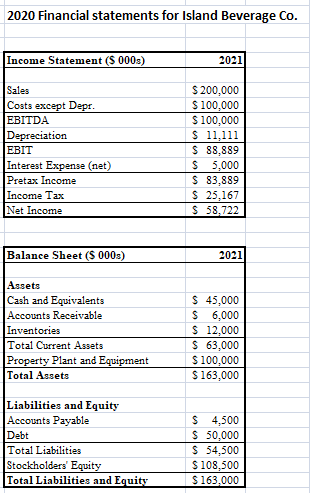
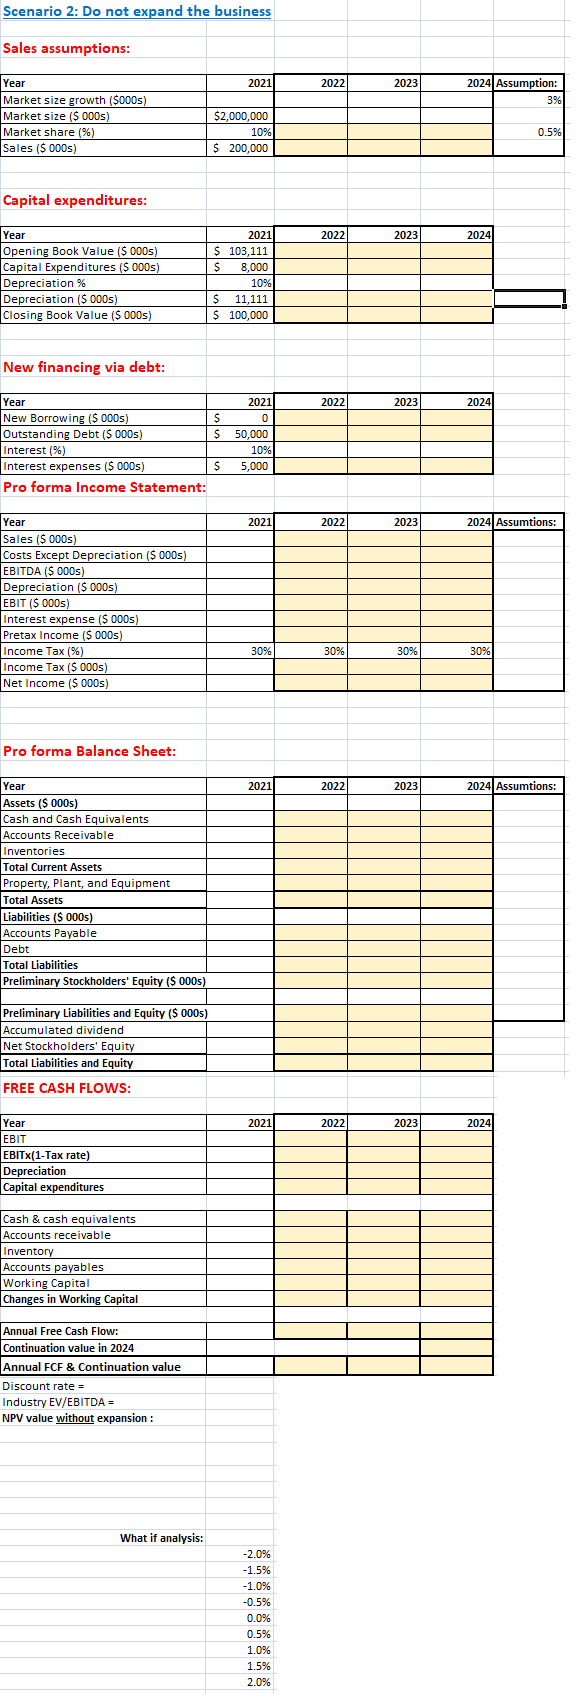
Your goal is to analyze whether or not the project adds value to your company. Your analysis consists of six parts. First, prepare pro forma income statements and balance sheets for year 2022, 2023, and 2024 under each scenario based on the assumptions listed above. Second, estimate annual free cash flow for each of the three years using the following formula:
Annual Free Cash Flow = EBIT x (1-tax rate) + Depreciation - Capital expenditures - Changes in Working capital
Third, estimate the company's continuation value (also known as terminal value) beyond 2024 by using the Enterprise value / EBITDA multiple I explained in class.
Forth, with your annual cash flows and continuation value forecast, estimate the company's value by computing the company's net present value (NPV) under each scenario. Use 16% as the discount rate.
Fifth, once you have estimated the NPVs, determine whether or not the project would increase the company's long term value by subtracting "No expansion" NPV from "Expansion" NPV.
Sixth, determine how the NPV under each scenario would change as the Market size growth rate varies from -2% to 5% with 0.5% increments using the "What-If" analysis tool in Excel. Read the instruction in "Excel What If analysis.docx" available on Laulima under "Class handouts" to learn how to use the tool
.


2020 Financial statements for Island Beverage Co. Income Statement (8 000) 2021 Sales Costs except Depr. EBITDA Depreciation EBIT Interest Expense (net) Pretax Income Income Tax Net Income $ 200,000 $ 100,000 $ 100,000 $ 11,111 $ 88,889 $ 5,000 $ 83,889 $ 25,167 $ 58,722 Balance Sheet ($ 000s) 2021 Assets Cash and Equivalents Accounts Receivable Inventories Total Current Assets Property Plant and Equipment Total Assets $ 45,000 $ 6,000 $ 12,000 $ 63,000 $ 100,000 $ 163,000 Liabilities and Equity Accounts Payable Debt Total Liabilities Stockholders' Equity Total Liabilities and Equity $ 4,500 $ 50,000 $ 54,500 $ 108,500 $ 163.000 Scenario 1: Expand the business Sales assumptions: 2021 2022 2023 2024 Assumption: 3%) Year Market size growth ($000s) Market size ($ 000s) Market share (%) Sales ($ 000s) $2,000,000 10% $ 200,000 1% Capital expenditures: 2022 2023 2024 Year Opening Book Value ($ 000s) Capital Expenditures ($ 000s) Depreciation % Depreciation (000s) Closing Book Value ($ 000s) 2021 $ 103,111 $ 8,000 10% % $ 11,111 $ 100,000 New financing via debt: 2022 2023 2024 Year 2021 New Borrowing ($ 000s) $ 0 Outstanding Debt ($ 000s) $ $ 50,000 Interest (%) 10% Interest expenses ($ 000s) $ 5,000 Pro forma Income Statement: 2021 2022 2023 2024 Assumtions: Year Sales ($ 000s) Costs Except Depreciation ($ 000s) EBITDA ($ 000s) Depreciation ($ 000s) EBIT ($ 000s) Interest expense ($ 000s) PRECAPS Pretax Income ($ 000s) Income Tax (%) Income Tax ($ 000s) $ Net Income ($ 000s) 30% 30% 30% 30% Pro forma Balance Sheet: 2021 2022 2023 2024 Assumtions: Year Assets ($ 000s) asm Cash and Cash Equivalents Accounts Receivable Inventories Total Current Assets Property, Plant, and Equipment Total Assets Liabilities ($ 000s) Accounts Payable Debt Total Liabilities Preliminary Stockholders' Equity ($ 000s) Preliminary Liabilities and Equity ($ 000s) Accumulated dividend Net Stockholders' Equity Total Liabilities and Equity FREE CASH FLOWS: 2021 2022 2023 2024 Year EBIT EBITx(1-Tax rate) Depreciation Capital expenditures Cash & cash equivalents Accounts receivable Inventory Accounts payables Working Capital Changes in Working Capital Annual Free Cash Flow: Continuation value in 2024 Annual FCF & Continuation value Discount rate = Industry EV/EBITDA= NPV value with expansion : NPV (Expansion) - NPV (No expansion) = What if analysis: -2.0% -1.5% -1.0% -0.5% 0.0% 0.5% 1.0% 1.5% 2.0% 2.5% 3.0% 3.5% 4.0% 4.5% Scenario 2: Do not expand the business Sales assumptions: 2021 2022 2023 2024 Assumption: 3% 3 Year Market size growth ($000s) Market size ($ 000s) Market share (%) Sales ($ 000s) ) $2,000,000 10% $ 200,000 0.5% Capital expenditures: 2022 2023 2024 Year Opening Book Value ($ 000s) Capital Expenditures ($ 000s) Depreciation % Depreciation ($ 000s) Closing Book Value ($ 000s) 2021) $ 103,111 $ $ 8,000 10% $ 11,111 $ 100.000 New financing via debt: 2022 2023 2024 $ $ Year New Borrowing ($ 000s) Outstanding Debt ($ 000s) Interest (%) Interest expenses ($ 000s) Pro forma Income Statement: 2021 0 50,000 10% 5,000 $ 2021 2022 2023 2024 Assumtions: Year Sales ($ 000s) Costs Except Depreciation ($ 000s) EBITDA ($ 000s) Depreciation ($ 000s) EBIT ($ 000s) VOUS) Interest expense ($ 000s) Pretax Income ($ 000s) $ Income Tax (%) Income Tax ($ 000s) Net Income ($ 000s) 30% 30% 30% 30% Pro forma Balance Sheet: 2021 2022 2023 2024 Assumtions: Year Assets ($ 000s) Cash and Cash Equivalents MAS" Accounts Receivable ALLY Inventories cm Total Current Assets Property, Plant, and Equipment Total Assets . Liabilities ($ 000s) Accounts Payable Debt Total Liabilities Preliminary Stockholders' Equity ($ 000s) Preliminary Liabilities and Equity ($ 000s) Accumulated dividend Net Stockholders' Equity Total Liabilities and Equity FREE CASH FLOWS: 2021 2022 2023 2024 Year EBIT EBITX(1-Tax rate) Depreciation Capital expenditures Cash & cash equivalents Accounts receivable Inventory Accounts payables Working Capital Changes in Working Capital Annual Free Cash Flow: Continuation value in 2024 Annual FCF & Continuation value Discount rate = = Industry EV/EBITDA = NPV value without expansion : What if analysis: -2.0% -1.5% -1.0% -0.5% 0.0% 0.5% 1.0% 1.5% 2.0% 2020 Financial statements for Island Beverage Co. Income Statement (8 000) 2021 Sales Costs except Depr. EBITDA Depreciation EBIT Interest Expense (net) Pretax Income Income Tax Net Income $ 200,000 $ 100,000 $ 100,000 $ 11,111 $ 88,889 $ 5,000 $ 83,889 $ 25,167 $ 58,722 Balance Sheet ($ 000s) 2021 Assets Cash and Equivalents Accounts Receivable Inventories Total Current Assets Property Plant and Equipment Total Assets $ 45,000 $ 6,000 $ 12,000 $ 63,000 $ 100,000 $ 163,000 Liabilities and Equity Accounts Payable Debt Total Liabilities Stockholders' Equity Total Liabilities and Equity $ 4,500 $ 50,000 $ 54,500 $ 108,500 $ 163.000 Scenario 1: Expand the business Sales assumptions: 2021 2022 2023 2024 Assumption: 3%) Year Market size growth ($000s) Market size ($ 000s) Market share (%) Sales ($ 000s) $2,000,000 10% $ 200,000 1% Capital expenditures: 2022 2023 2024 Year Opening Book Value ($ 000s) Capital Expenditures ($ 000s) Depreciation % Depreciation (000s) Closing Book Value ($ 000s) 2021 $ 103,111 $ 8,000 10% % $ 11,111 $ 100,000 New financing via debt: 2022 2023 2024 Year 2021 New Borrowing ($ 000s) $ 0 Outstanding Debt ($ 000s) $ $ 50,000 Interest (%) 10% Interest expenses ($ 000s) $ 5,000 Pro forma Income Statement: 2021 2022 2023 2024 Assumtions: Year Sales ($ 000s) Costs Except Depreciation ($ 000s) EBITDA ($ 000s) Depreciation ($ 000s) EBIT ($ 000s) Interest expense ($ 000s) PRECAPS Pretax Income ($ 000s) Income Tax (%) Income Tax ($ 000s) $ Net Income ($ 000s) 30% 30% 30% 30% Pro forma Balance Sheet: 2021 2022 2023 2024 Assumtions: Year Assets ($ 000s) asm Cash and Cash Equivalents Accounts Receivable Inventories Total Current Assets Property, Plant, and Equipment Total Assets Liabilities ($ 000s) Accounts Payable Debt Total Liabilities Preliminary Stockholders' Equity ($ 000s) Preliminary Liabilities and Equity ($ 000s) Accumulated dividend Net Stockholders' Equity Total Liabilities and Equity FREE CASH FLOWS: 2021 2022 2023 2024 Year EBIT EBITx(1-Tax rate) Depreciation Capital expenditures Cash & cash equivalents Accounts receivable Inventory Accounts payables Working Capital Changes in Working Capital Annual Free Cash Flow: Continuation value in 2024 Annual FCF & Continuation value Discount rate = Industry EV/EBITDA= NPV value with expansion : NPV (Expansion) - NPV (No expansion) = What if analysis: -2.0% -1.5% -1.0% -0.5% 0.0% 0.5% 1.0% 1.5% 2.0% 2.5% 3.0% 3.5% 4.0% 4.5% Scenario 2: Do not expand the business Sales assumptions: 2021 2022 2023 2024 Assumption: 3% 3 Year Market size growth ($000s) Market size ($ 000s) Market share (%) Sales ($ 000s) ) $2,000,000 10% $ 200,000 0.5% Capital expenditures: 2022 2023 2024 Year Opening Book Value ($ 000s) Capital Expenditures ($ 000s) Depreciation % Depreciation ($ 000s) Closing Book Value ($ 000s) 2021) $ 103,111 $ $ 8,000 10% $ 11,111 $ 100.000 New financing via debt: 2022 2023 2024 $ $ Year New Borrowing ($ 000s) Outstanding Debt ($ 000s) Interest (%) Interest expenses ($ 000s) Pro forma Income Statement: 2021 0 50,000 10% 5,000 $ 2021 2022 2023 2024 Assumtions: Year Sales ($ 000s) Costs Except Depreciation ($ 000s) EBITDA ($ 000s) Depreciation ($ 000s) EBIT ($ 000s) VOUS) Interest expense ($ 000s) Pretax Income ($ 000s) $ Income Tax (%) Income Tax ($ 000s) Net Income ($ 000s) 30% 30% 30% 30% Pro forma Balance Sheet: 2021 2022 2023 2024 Assumtions: Year Assets ($ 000s) Cash and Cash Equivalents MAS" Accounts Receivable ALLY Inventories cm Total Current Assets Property, Plant, and Equipment Total Assets . Liabilities ($ 000s) Accounts Payable Debt Total Liabilities Preliminary Stockholders' Equity ($ 000s) Preliminary Liabilities and Equity ($ 000s) Accumulated dividend Net Stockholders' Equity Total Liabilities and Equity FREE CASH FLOWS: 2021 2022 2023 2024 Year EBIT EBITX(1-Tax rate) Depreciation Capital expenditures Cash & cash equivalents Accounts receivable Inventory Accounts payables Working Capital Changes in Working Capital Annual Free Cash Flow: Continuation value in 2024 Annual FCF & Continuation value Discount rate = = Industry EV/EBITDA = NPV value without expansion : What if analysis: -2.0% -1.5% -1.0% -0.5% 0.0% 0.5% 1.0% 1.5% 2.0%


