Question
Corporation prepares its financial statements according to U.S. GAAP. Targets financial statements and disclosure notes for the year ended February 3, 2018, are available here.
Corporation prepares its financial statements according to U.S. GAAP. Target’s financial statements and disclosure notes for the year ended February 3, 2018, are available here. This material is also available under the Investor Relations link at the company’s website (www.target.com).
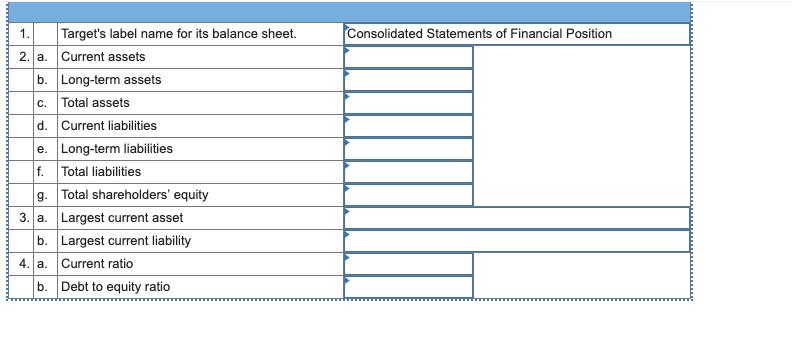
By what name does Target label its balance sheet?
What amounts did Target report for the following items on February 3, 2018?
What was Target’s largest current asset?
What was its largest current liability?
Compute Target’s current ratio and debt to equity ratio is 2018?

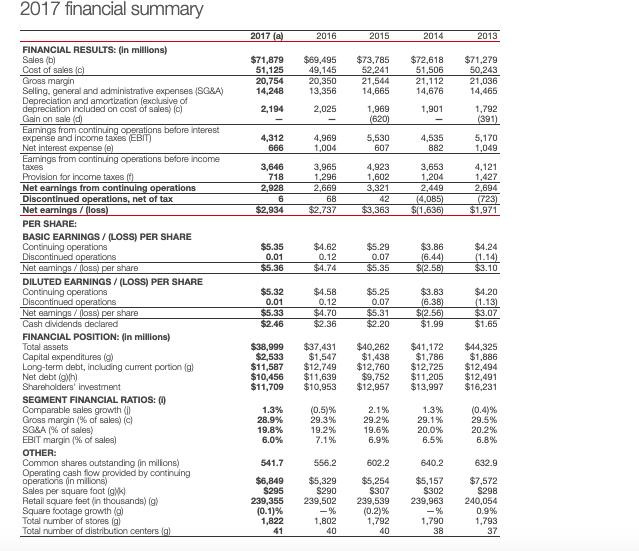
2017 financial summary 2017 (a) 2016 2015 2014 2013 FINANCIAL RESULTS: (In millons) Sales (b) Cost of sales (c) Gross margin Seling, general and administrative expenses (SG&A) Depreciation and amortization (exclusive of depreciation included on cost of sdes) (c) Gain on sale (d) Earnings from continuing operations before interest Expene and income taxes (EBIT) Net interest expense (e) Earnings from continuing operations before income taxes Provision for income taxes () $71,879 51,125 20,754 14,248 $69,495 49,145 20,350 13,356 $73,785 52,241 21,544 14,665 $72,618 51,506 21,112 14,676 $71,279 50,243 21,036 14,465 2,194 2,025 1,969 (620) 1,901 1,792 (391) 4,312 666 4,969 1,004 5,530 607 4,535 882 5,170 1,049 3,646 718 Net eanings from continuing operations Discontinued operations, net of tax Net eamings / (loss) 3,965 1,296 2,669 68 4,923 1,602 3,321 42 3,653 1,204 2,449 (4,085) $(1,636) 4,121 1,427 2,694 (723) $1.971 2,928 $2,934 $2,737 $3,363 PER SHARE: BASIC EARNINGS / (LOSS) PER SHARE Continuing operations Discontinued operations Net eamings / (loss) per share DILUTED EARNINGS / (LOSS) PER SHARE Continuing operations Discontinued operations Net eamings / (loss) per share Cash dividends declared $5.35 0.01 $4.62 0.12 $5.29 0.07 $3.86 (6.44) $(2.58) $4.24 (1.14) $3.10 $5.36 $4.74 $5.35 $5.32 0.01 $4.58 0.12 $4.70 $2.36 $5.25 0.07 $5.31 $2.20 $3.83 (6.38) $(2.56) $1.99 $4.20 (1.13) $3.07 $1.65 $5.33 $2.46 FINANCIAL POSITION: (In millions) Total assets Capital expenditures (g) Long-term debt, including current portion (g) Net debt (g)h) Shareholders' investment $38,999 $2,533 $11,587 $10,456 $11,709 $37,431 $1,547 $12,749 $11,639 $10,953 $40,262 $1,438 $12,760 $9,752 $12,957 $41,172 $1,786 $12,725 $11,205 $13,997 $44,325 $1,886 $12,494 $12,491 $16,231 SEGMENT FINANCIAL RATIOS: () Comparable sales growth () Gross margin (% of sales) (c) SG&A (% of sales) EBIT margin (% of sales) 1.3% 28.9% (0.5)% 29.3% 19.2% 7.1% 2.1% 29.2% 1.3% 29.1% (0.4)% 29.5% 19.8% 6.0% 19.6% 6.9% 20.0% 6.5% 20.2% 6.8% OTHER: Common shares outstanding (in millons) Operating cash flow provided by continuing operationis (in millions) Sales per square foot (gk) Retail square foot (in thousands) (g) Square footage growth (g) Total number of stores (g) Total number of distribution centers (g) 541.7 556.2 602.2 640.2 632.9 $6,849 $295 $5,329 $290 239,502 - % $5,254 $307 239,539 (0.2)% 1,792 $5,157 $302 $7,572 $298 239,355 (0.1)% 1,822 41 239,963 -% 1,790 38 240,054 0.9% 1,793 37 1,802 40 40
Step by Step Solution
3.50 Rating (160 Votes )
There are 3 Steps involved in it
Step: 1

Get Instant Access to Expert-Tailored Solutions
See step-by-step solutions with expert insights and AI powered tools for academic success
Step: 2

Step: 3

Ace Your Homework with AI
Get the answers you need in no time with our AI-driven, step-by-step assistance
Get Started


