Answered step by step
Verified Expert Solution
Question
1 Approved Answer
Task 1: Accumulation phase modelling (40%) You are to build a spreadsheet in Excel that will model the accumulation phase of your superannuation account.
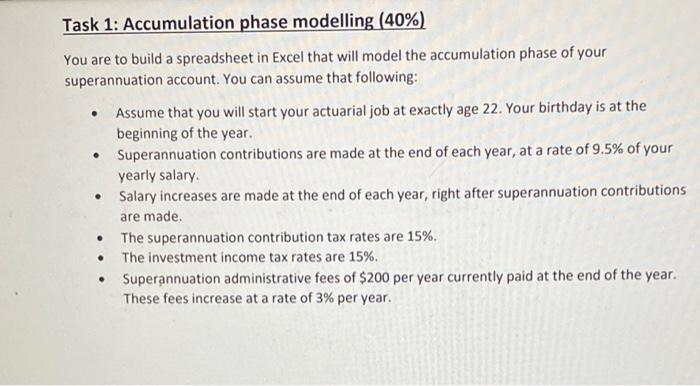
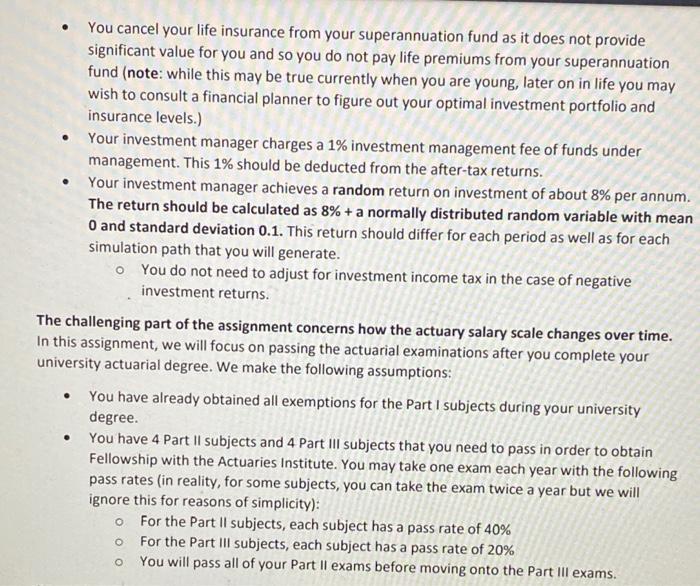
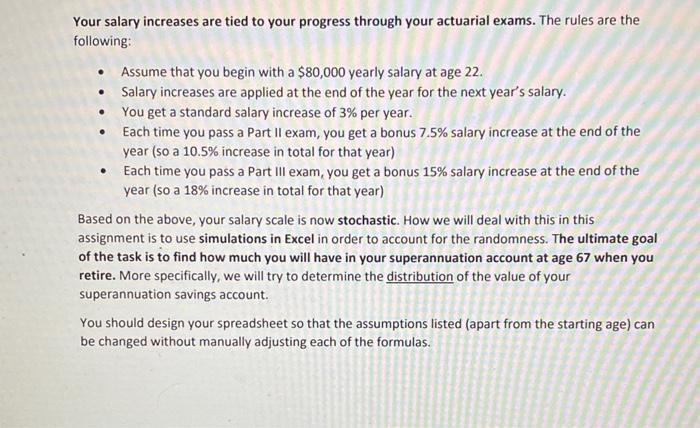
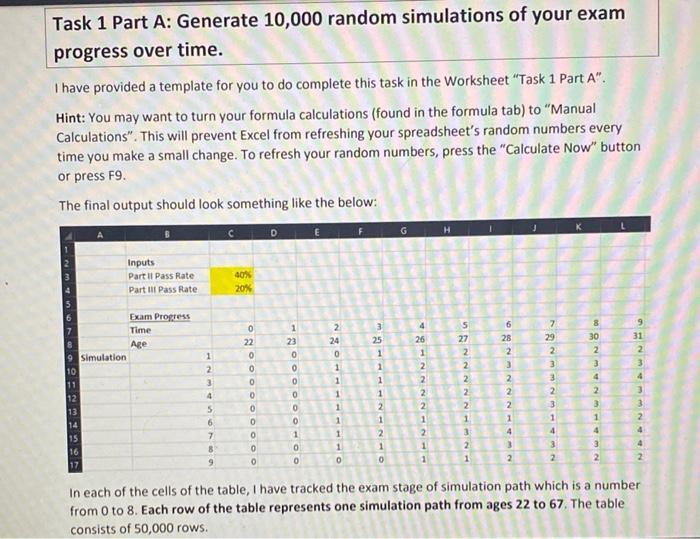
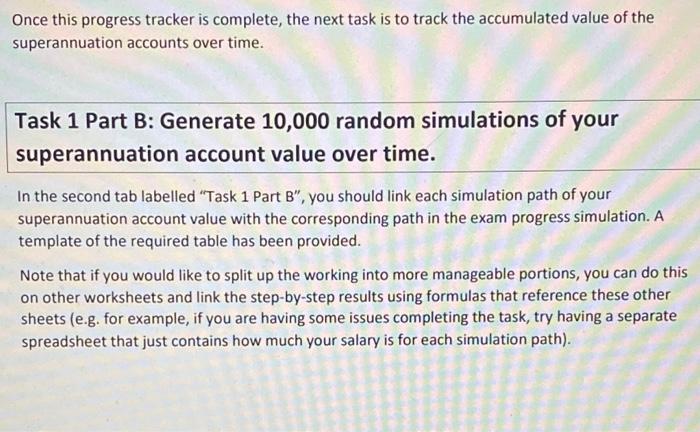
Task 1: Accumulation phase modelling (40%) You are to build a spreadsheet in Excel that will model the accumulation phase of your superannuation account. You can assume that following: . Assume that you will start your actuarial job at exactly age 22. Your birthday is at the beginning of the year. Superannuation contributions are made at the end of each year, at a rate of 9.5% of your yearly salary. Salary increases are made at the end of each year, right after superannuation contributions are made. The superannuation contribution tax rates are 15%. The investment income tax rates are 15%. Superannuation administrative fees of $200 per year currently paid at the end of the year. These fees increase at a rate of 3% per year. You cancel your life insurance from your superannuation fund as it does not provide significant value for you and so you do not pay life premiums from your superannuation fund (note: while this may be true currently when you are young, later on in life you may wish to consult a financial planner to figure out your optimal investment portfolio and insurance levels.) Your investment manager charges a 1% investment management fee of funds under management. This 1% should be deducted from the after-tax returns. The challenging part of the assignment concerns how the actuary salary scale changes over time. In this assignment, we will focus on passing the actuarial examinations after you complete your university actuarial degree. We make the following assumptions: Your investment manager achieves a random return on investment of about 8% per annum. The return should be calculated as 8% + a normally distributed random variable with mean 0 and standard deviation 0.1. This return should differ for each period as well as for each simulation path that you will generate. You do not need to adjust for investment income tax in the case of negative investment returns. You have already obtained all exemptions for the Part I subjects during your university degree. You have 4 Part Il subjects and 4 Part III subjects that you need to pass in order to obtain Fellowship with the Actuaries Institute. You may take one exam each year with the following pass rates (in reality, for some subjects, you can take the exam twice a year but we will ignore this for reasons of simplicity): O O O For the Part II subjects, each subject has a pass rate of 40% For the Part III subjects, each subject has a pass rate of 20% You will pass all of your Part Il exams before moving onto the Part IIIl exams. Your salary increases are tied to your progress through your actuarial exams. The rules are the following: Assume that you begin with a $80,000 yearly salary at age 22. Salary increases are applied at the end of the year for the next year's salary. You get a standard salary increase of 3% per year. Each time you pass a Part II exam, you get a bonus 7.5% salary increase at the end of the year (so a 10.5% increase in total for that year) Each time you pass a Part III exam, you get a bonus 15% salary increase at the end of the year (so a 18% increase in total for that year) Based on the above, your salary scale is now stochastic. How we will deal with this in this assignment is to use simulations in Excel in order to account for the randomness. The ultimate goal of the task is to find how much you will have in your superannuation account at age 67 when you retire. More specifically, we will try to determine the distribution of the value of your superannuation savings account. You should design your spreadsheet so that the assumptions listed (apart from the starting age) can be changed without manually adjusting each of the formulas. Task 1 Part A: Generate 10,000 random simulations of your exam progress over time. I have provided a template for you to do complete this task in the Worksheet "Task 1 Part A". Hint: You may want to turn your formula calculations (found in the formula tab) to "Manual Calculations". This will prevent Excel from refreshing your spreadsheet's random numbers every time you make a small change. To refresh your random numbers, press the "Calculate Now" button or press F9. The final output should look something like the below: 9 Simulation 10 11 12 13 14 15 16 17 Inputs Part II Pass Rate Part III Pass Rate Exam Progress Time Age 1 123 4 5 6 7 8 9 C 40% 20% 0 ONOOOOOO 22 0 0 0 0 0 0 0 D 120000. 23 0 1 0 0 E 2 24 0 1 1 1 1 1 1 0 3 25 1 1 1 1 2 1 2 1 0 G 4 26 1 2222 1 H 5722 2222 1 3 2 1 62232~~~ 28 1 4 2 745 29 2 3 Wat 32 2 3 1 4 8 30 2 3 4 2 3 1 31 2 3 4 3 3 2 4 In each of the cells of the table, I have tracked the exam stage of simulation path which is a number from 0 to 8. Each row of the table represents one simulation path from ages 22 to 67. The table consists of 50,000 rows. Once this progress tracker is complete, the next task is to track the accumulated value of the superannuation accounts over time. Task 1 Part B: Generate 10,000 random simulations of your superannuation account value over time. In the second tab labelled "Task 1 Part B", you should link each simulation path of your superannuation account value with the corresponding path in the exam progress simulation. A template of the required table has been provided. Note that if you would like to split up the working into more manageable portions, you can do this on other worksheets and link the step-by-step results using formulas that reference these other sheets (e.g. for example, if you are having some issues completing the task, try having a separate spreadsheet that just contains how much your salary is for each simulation path).
Step by Step Solution
★★★★★
3.42 Rating (149 Votes )
There are 3 Steps involved in it
Step: 1
To generate 10000 random simulations of exam progress over time and the corresponding superannuation account value over time well follow these steps T...
Get Instant Access to Expert-Tailored Solutions
See step-by-step solutions with expert insights and AI powered tools for academic success
Step: 2

Step: 3

Ace Your Homework with AI
Get the answers you need in no time with our AI-driven, step-by-step assistance
Get Started


