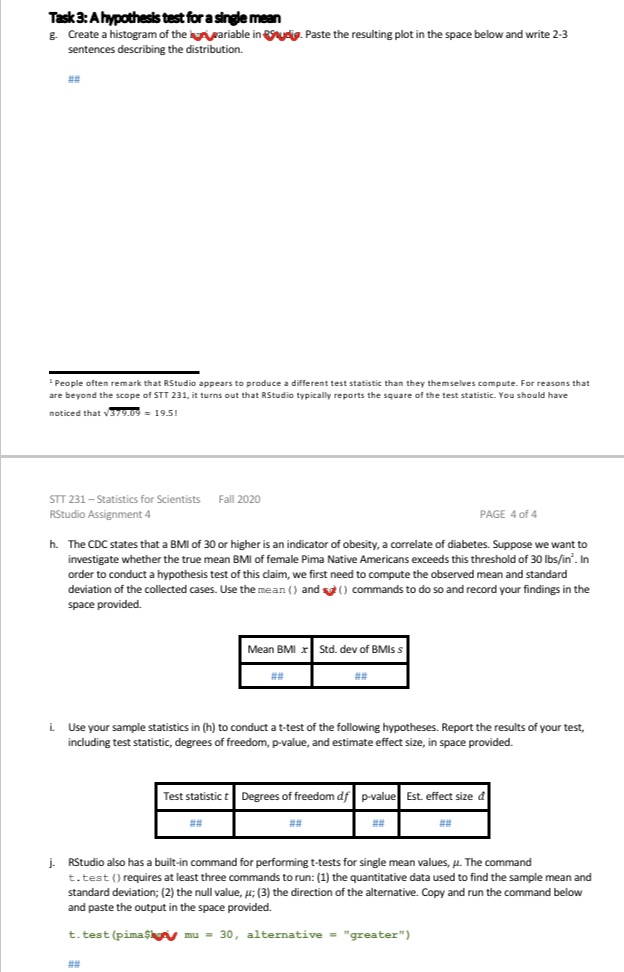
Task 3: A hypothesis test for a single mean g Create a histogram of the hourariable in Studio. Paste the resulting plot in the space below and write 2-3 sentences describing the distribution. ## People often remark that RStudio appears to produce a different test statistic than they themselves compute. For reasons that are beyond the scope of STT 231, it turns out that RStudio typically reports the square of the test statistic. You should have noticed that v379.09 = 19.5! STT 231 - Statistics for Scientists Fall 2020 RStudio Assignment 4 PAGE 4 of 4 h. The CDC states that a BMI of 30 or higher is an indicator of obesity, a correlate of diabetes. Suppose we want to investigate whether the true mean BMI of female Pima Native Americans exceeds this threshold of 30 lbs/in' . In order to conduct a hypothesis test of this claim, we first need to compute the observed mean and standard deviation of the collected cases. Use the mean () and # () commands to do so and record your findings in the space provided. Mean BMI x Std. dev of BMIs s ## # # i Use your sample statistics in (h) to conduct a t-test of the following hypotheses. Report the results of your test, including test statistic, degrees of freedom, p-value, and estimate effect size, in space provided. Test statistic t Degrees of freedom df p-value Est. effect size d # # # # ## j. RStudio also has a built-in command for performing t-tests for single mean values, J. The command t. test () requires at least three commands to run: (1) the quantitative data used to find the sample mean and standard deviation; (2) the null value, A; (3) the direction of the alternative. Copy and run the command below and paste the output in the space provided. t. test (pima$hm\\ mu = 30, alternative = "greater")