Task
Consider the annual report of Adidas for a period of 4 years. Using the different financial ratios, we covered in this course you are required to:
1) critically evaluate the financial statements individually across the 4-year period and cross-sectionally and identify their main strengths and weaknesses, and
2) make recommendations for future improvement.
Note: Students are expected to comment on the change of company financial performance (income statement) and position (balance sheet) during the 4-year period of examination by looking at the main accounts and how they have changed (information may be taken from the notes to the accounts). The aim of this assignment is to familiarize students with the information content of annual reports.
Below, i provide Income statements of Adidas and Financial Highlights. (Balance sheet was not provided)
Here's the example of how work should be done:
https://www.chegg.com/homework-help/questions-and-answers/consider-annual-report-nike-period-4-years-using-different-financial-ratios-covered-course-q66019737?trackid=M4RfaZBP
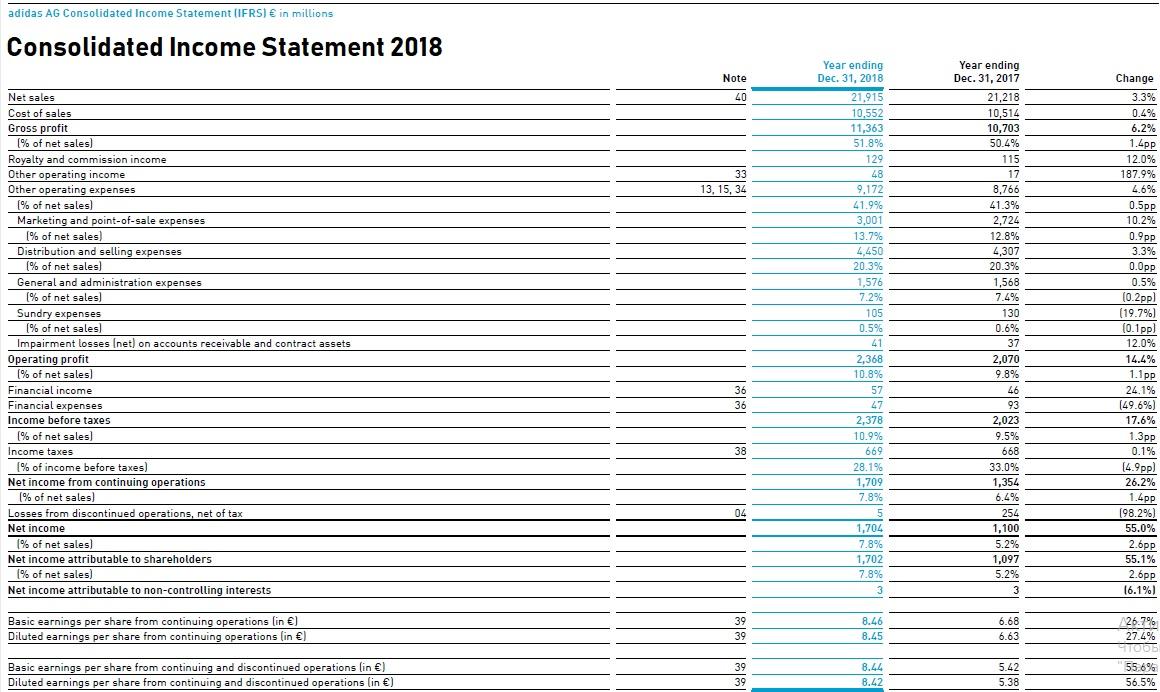
Income statement 2018:
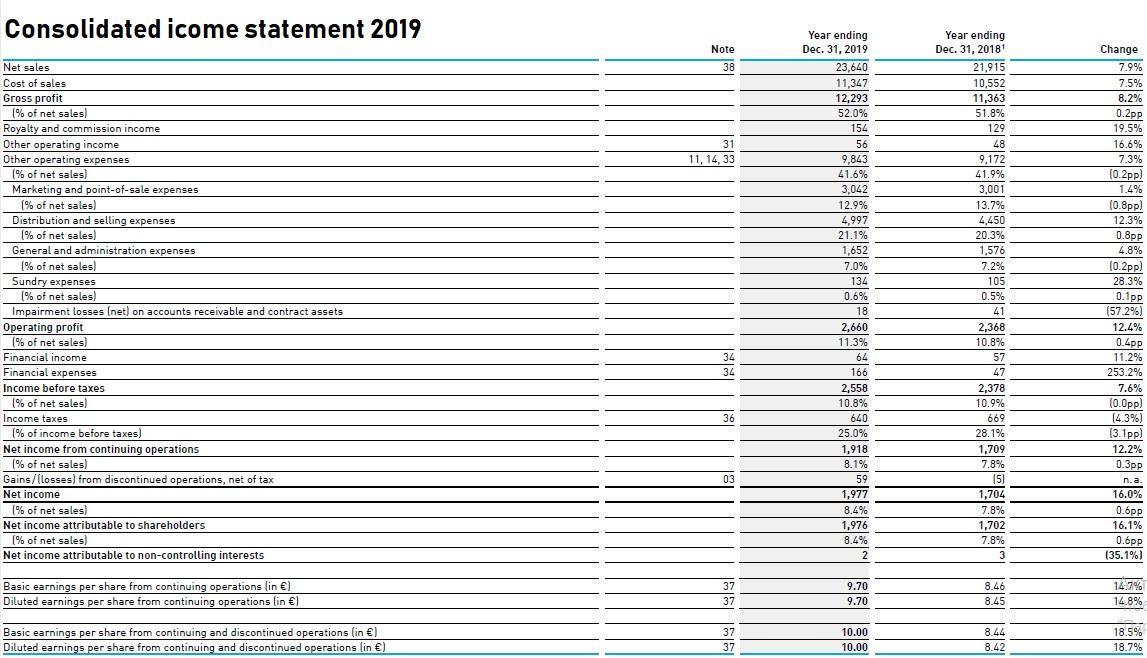
Income statement 2019:
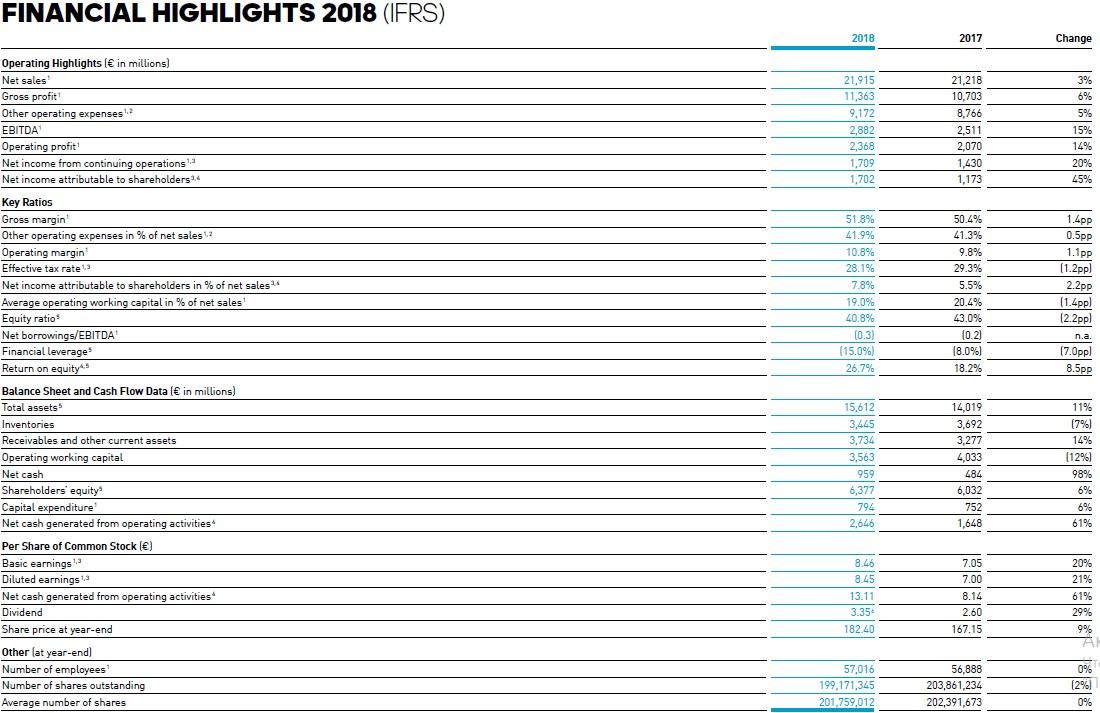
Financial highlights 2018:
Financial highlights 2019:
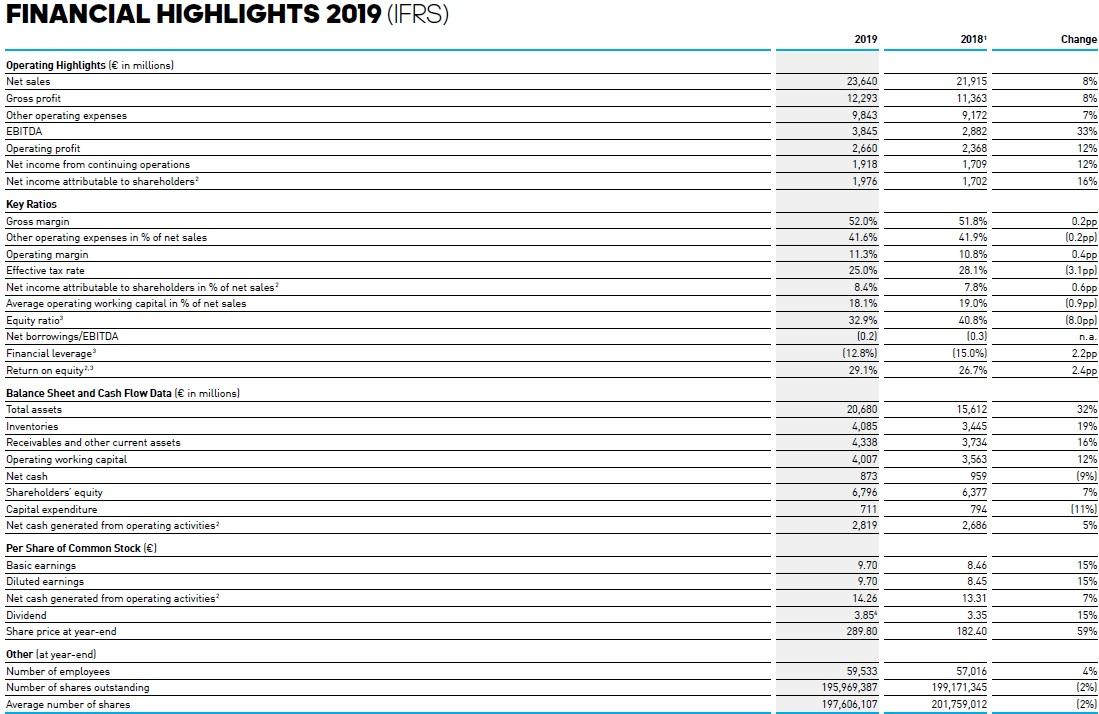
adidas AG Consolidated Income Statement (IFRS) in millions Consolidated Income Statement 2018 Note 40 Change 3.3% 0.4% 6.2% 33 13, 15, 34 1% of net sales) Year ending Dec. 31, 2018 21,915 10.552 11,363 51.8% 129 48 9,172 41.9% 3,001 13.7% 4.450 20.3% 1,576 7.2% 105 0.5% 41 2,368 10.8% 57 47 2,378 10.9% 669 28.1% 1,709 7.8% Net sales Cost of sales Gross profit 1% of net sales) Royalty and commission income Other operating income Other operating expenses [% of net sales) Marketing and point-of-sale expenses [% of net sales) Distribution and selling expenses Tar General and administration expenses 1% of net sales) Sundry expenses [% of net sales! Impairment losses (net) on accounts receivable and contract assets Operating profit % of net sales) Financial income Financial expenses Income before taxes % of net sales] Income taxes % of income before taxes) Net income from continuing operations (% of net sales) Losses from discontinued operations, net of tax Net income % of net sales) Net income attributable to shareholders % of net sales) t% Net income attributable to non-controlling interests ] Year ending Dec. 31, 2017 21,218 10,514 10,703 30.47 50.4% 115 17 8,766 41.3% 2,724 12.8% 4,307 20.3% 1,568 1 548 7.4% 130 0.6% 37 2,070 9.8% 0 46 93 2,023 9.5% 668 33.0% 1,354 6.4% 254 1,100 5.2% 1,097 5.2% 3 1.4pp 12.0% % 187.9% 4.6% .JPP 0.5pp 10.2% 0.9 pp 3.3% 0.Opp 0.5% (0.2pp) (19.7%) ( (0.1 pp] 12.02 12.0% 14.4% 1.1 pp 24.1% (49.6%) 17.6% 1.3pp 0.1% (4.9 pp] 26.2% 1.4 pp (98.2%) 55.0% 2.bpp 55.1% 2.bpp 16.1%) 36 36 38 04 1,704 7.8% 1,702 7.8% 3 Basic earnings per share from continuing operations in ) Diluted earnings per share from continuing operations (in ) 39 39 8.46 8.45 6.68 6.63 26.7% 27.4% TOOL 55.6% 56.5% Basic earnings per share from continuing and discontinued operations (in ) Diluted earnings per share from continuing and discontinued operations (in ) 39 39 8.44 8.42 5.42 5.38 Consolidated icome statement 2019 Note 38 31 11, 14, 33 Net sales Cost of sales Gross profit (% of net sales Royalty and commission income Other operating income Other operating expenses 1% of net sales) Marketing and point-of-sale expenses 1% of net sales) Distribution and selling expenses (% of net sales) General and administration expenses % of net sales) Sundry expenses 1% % of net sales) Impairment losses (net) on accounts receivable and contract assets Operating profit 1% of net sales) Financial income Financial expenses Income before taxes [% of net sales) Income taxes (% of income before taxes) Net income from continuing operations 1 % of net sales) Gains/(losses) from discontinued operations, net of tax Net income % of net sales) Net income attributable to shareholders [% of net sales) Net income attributable to non-controlling interests Year ending Dec. 31, 2019 23,640 11,347 12,293 52.0% 154 56 9,843 41.6% 41.0% 3,042 12.9% 4.997 21.1% 1,652 7.0% 134 0.6% 18 2,660 11.3% 64 166 2,558 10.8% 640 25.0% 1,918 8.1% 59 1,977 8.4% 1,976 8.4% 2 Year ending Dec. 31, 2018 21,915 10,552 11,363 51.8% 129 48 9.172 41.9% 3,001 13.7% 4,450 20.3% 1,576 7.2% 105 0.5% 41 2,368 10.8% 57 47 2,378 10.9% 669 28.1% 1,709 7.8% (5) 1,704 7.8% 1,702 7.8% 3 Change 7.9% 7.5% 8.2% 0.2pp 19.5% 16.6% 7.3% (0.2pp) 1.4% (0.8pp. 12.3% 0.8pp 4.8% (0.2pp) 28.3% 012 (57.2%) 12.4% 0.4pp 11.2% 253.2% 7.6% (0.0pp) 14.3%) (3.1 pp) 12.2% 0.3pp na. 16.0% 0.6pp 16.1% 0.6pp (35.1%) 34 34 36 03 Basic earnings per share from continuing operations in ) Diluted earnings per share from continuing operations (in ) 37 37 9.70 9.70 8.46 8.45 14.7% 14.8% Basic earnings per share from continuing and discontinued operations (in ) Diluted earnings per share from continuing and discontinued operations (in ) 37 37 10.00 10.00 8.44 8.42 - 18.5% 18.7% FINANCIAL HIGHLIGHTS 2018 (IFRS) 2018 2017 Change 21.915 11,363 Operating Highlights ( in millions) Net sales Gross profit 1,2 Other operating expenses EBITDA Operating profit Net income from continuing operations! Net income attributable to shareholders 9,172 2,882 2,368 1,709 1,702 21,218 10,703 8.766 2,511 2,070 1,430 1,173 3% 6% 5% 15% 14% 20% 45% Key Ratios Gross margin Other operating expenses in % of net sales12 Operating margin Effective tax rate! Net income attributable to shareholders in % of net sales Average operating working capital in % of net sales Equity ratio Net borrowings/EBITDA Financial leverage Return on equity- 51.8% 41.9% 10.8% 28.1% 7.8% 19.0% 40.8% (0.3) (15.0%) 26.7% 50.4% 41.3% 9.8% 29.3% 5.5% 20.4% 43.0% (0.2) (8.0%) 18.2% 1.4pp 0.5pp 1. PP (1.2 pp 2.2pp (1.4pp! (2.2 pp) n.a. (7.0ppl 8.5pp 15,612 3,445 3,734 3,563 959 6,377 794 2,646 14,019 3,692 3,277 4,033 484 6,032 752 1,648 11% (7%) 14% (12%) 98% 6% 6% 61% Balance Sheet and Cash Flow Data ( in millions) Total assets Inventories Receivables and other current assets Operating working capital Net cash Shareholders' equity Capital expenditure Net cash generated from operating activities Per Share of Common Stock () Basic earnings Diluted earnings Net cash generated from operating activities Dividend Share price at year-end Other lat year-end) Number of employees Number of shares outstanding Average number of shares 8.46 8.45 13.11 3.35 182.40 7.05 7.00 8.14 2.60 167.15 20% 21% 61% 29% 9% 57,016 199,171,345 201,759,012 56,888 203,861,234 202,391,673 0% (2%) 0% FINANCIAL HIGHLIGHTS 2019 (IFRS) 2019 2018 Change Operating Highlights ( in millions) Net sales Gross profit Other operating expenses EBITDA Operating profit Net income from continuing operations Net income attributable to shareholders 23,640 12,293 9,843 3,845 2,660 1,918 1,976 21,915 11,363 9,172 2,882 2.368 1,709 1,702 8% 8% 7% 33% 12% 12% 16% 52.0% 41.6% 11.3% 25.0% 8.4% 18.1% 32.9% (0.2) (12.8%) 29.1% 51.8% 41.9% 10.8% 28.1% 7.8% 19.0% 40.8% (0.3) (15.0%) 26.7% 0.2 pp (0.2pp) 0.4pp (3.1 pp] 0.bpp (0.9ppl (8.Oppl n.a. 2.2 pp 2.4pp Key Ratios Gross margin Other operating expenses in % of net sales Operating margin Effective tax rate Net income attributable to shareholders in % of net sales Average operating working capital in % of net sales Equity ratio Net borrowings/EBITDA Financial leverage Return on equity Balance Sheet and Cash Flow Data ( in millions) Total assets Inventories Receivables and other current assets Operating working capital Net cash Shareholders' equity Capital expenditure Net cash generated from operating activities Per Share of Common Stock () Basic earnings Diluted earnings Net cash generated from operating activities? Dividend Share price at year-end 20,680 4,085 4,338 4,007 873 6,796 711 2,819 15,612 3,445 3,734 3,563 959 6,377 794 2,686 32% 19% 16% 12% (9%) 7% (11%) 5% 9.70 9.70 8.46 8.45 15% 15% 7% 14.26 3.85 289.80 13.31 3.35 182.40 15% 59% Other lat year-end) Number of employees Number of shares outstanding Average number of shares 59,533 195,969,387 197,606,107 57,016 199,171,345 201,759,012 4% (2% (2%)