Question
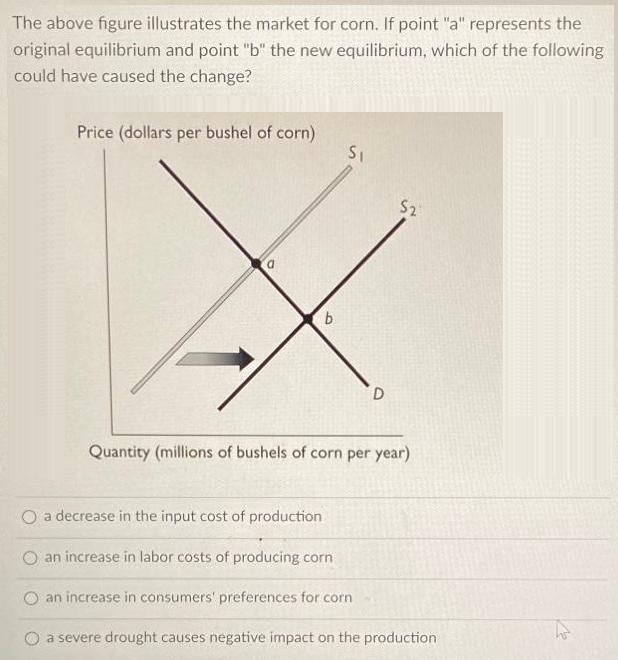
The above figure illustrates the market for corn. If point a represents the original equilibrium and point b the new equilibrium, which of the

The above figure illustrates the market for corn. If point "a" represents the original equilibrium and point "b" the new equilibrium, which of the following could have caused the change? Price (dollars per bushel of corn) a b S a decrease in the input cost of production an increase in labor costs of producing corn D Quantity (millions of bushels of corn per year) an increase in consumers' preferences for corn S2 a severe drought causes negative impact on the production
Step by Step Solution
3.48 Rating (158 Votes )
There are 3 Steps involved in it
Step: 1
The detailed answer for the above question is provided below A decrease in the input cost of production could have caused the change from point a to p...
Get Instant Access to Expert-Tailored Solutions
See step-by-step solutions with expert insights and AI powered tools for academic success
Step: 2

Step: 3

Ace Your Homework with AI
Get the answers you need in no time with our AI-driven, step-by-step assistance
Get StartedRecommended Textbook for
Income Tax Fundamentals 2013
Authors: Gerald E. Whittenburg, Martha Altus Buller, Steven L Gill
31st Edition
1111972516, 978-1285586618, 1285586611, 978-1285613109, 978-1111972516
Students also viewed these Accounting questions
Question
Answered: 1 week ago
Question
Answered: 1 week ago
Question
Answered: 1 week ago
Question
Answered: 1 week ago
Question
Answered: 1 week ago
Question
Answered: 1 week ago
Question
Answered: 1 week ago
Question
Answered: 1 week ago
Question
Answered: 1 week ago
Question
Answered: 1 week ago
Question
Answered: 1 week ago
Question
Answered: 1 week ago
Question
Answered: 1 week ago
Question
Answered: 1 week ago
Question
Answered: 1 week ago
Question
Answered: 1 week ago
Question
Answered: 1 week ago
Question
Answered: 1 week ago
Question
Answered: 1 week ago
Question
Answered: 1 week ago
Question
Answered: 1 week ago
Question
Answered: 1 week ago
Question
Answered: 1 week ago
Question
Answered: 1 week ago
View Answer in SolutionInn App


