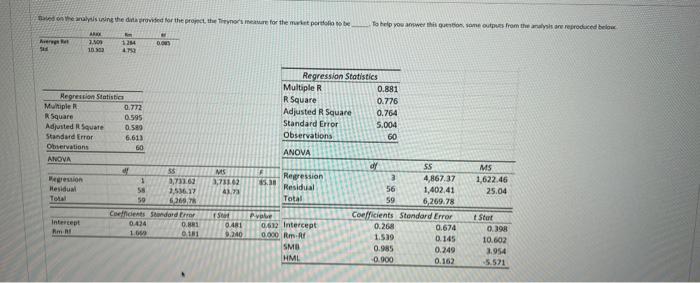
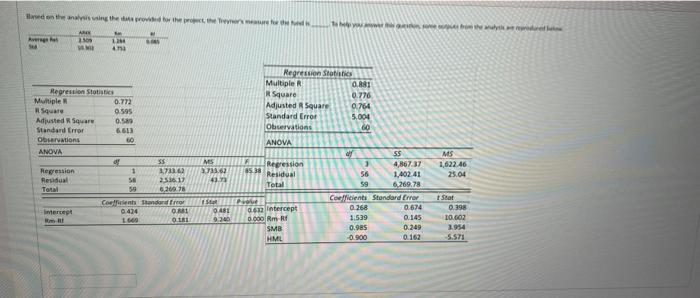
te on the analysing the data red for the project, the Theorier for the mult portfolio To help you answer the same out from the analysis are reproduced below here ARE 7.10 100 DO 121 4752 Hegression Statistics Multiple 0.772 R Square 0.595 Adjusted Square 05 Standard Error 6,613 Observations 60 ANOVA SMS ression 1 0,733.62 1,711.02 Hesidual 58 7.546.17 43. Total 59 6,269,7 Coefidents Standard Error St Intercept 0.414 0.81 0.481 1.69 181 0.240 Regression Statistics Multiple R 0.881 R Square 0.776 Adjusted R Square 0.764 Standard Error 5.004 Observations 60 ANOVA dy SS Regression 3 4,867.37 15.30 Residual 56 1,402,41 Total 59 6,269.78 Coefficients Standard Error 0.622 Intercept 0.268 0.674 0.000 Rm. 1.519 0.145 SMO 0.985 0.249 HML 0.900 0.162 MS 1,622.46 25.04 t Stut 0.398 10.602 3,954 5.521 Based on the analysing the provided for the new towy AR Real LI che Regression Stathis Multiple R 0,881 R Square 0.776 Adjusted Square 0.764 Standard Error 5.004 Observations 80 ANOVA Regression Stotis Multiple 0.772 Square 0.595 Adjusted Square 0.5 Standard Error 6,613 Obrations 60 ANOVA of 55 Regression 1 17 Residual 56 2536 17 Total 6,200 Concordo meret 0.44 OM ma LA OLE NES 78.02 Regression MS 1,622.46 25.04 40 6538 Residual Total SS 4,867.37 56 1.402.41 59 626978 Coefficiente Standard Error 0.268 0.674 1.539 0.145 0.985 0.249 -0.900 0.162 P Star 0401 9240 Intercept 0 0 6 B SMB HML Stat 0.398 10.602 3.954 5.571 te on the analysing the data red for the project, the Theorier for the mult portfolio To help you answer the same out from the analysis are reproduced below here ARE 7.10 100 DO 121 4752 Hegression Statistics Multiple 0.772 R Square 0.595 Adjusted Square 05 Standard Error 6,613 Observations 60 ANOVA SMS ression 1 0,733.62 1,711.02 Hesidual 58 7.546.17 43. Total 59 6,269,7 Coefidents Standard Error St Intercept 0.414 0.81 0.481 1.69 181 0.240 Regression Statistics Multiple R 0.881 R Square 0.776 Adjusted R Square 0.764 Standard Error 5.004 Observations 60 ANOVA dy SS Regression 3 4,867.37 15.30 Residual 56 1,402,41 Total 59 6,269.78 Coefficients Standard Error 0.622 Intercept 0.268 0.674 0.000 Rm. 1.519 0.145 SMO 0.985 0.249 HML 0.900 0.162 MS 1,622.46 25.04 t Stut 0.398 10.602 3,954 5.521 Based on the analysing the provided for the new towy AR Real LI che Regression Stathis Multiple R 0,881 R Square 0.776 Adjusted Square 0.764 Standard Error 5.004 Observations 80 ANOVA Regression Stotis Multiple 0.772 Square 0.595 Adjusted Square 0.5 Standard Error 6,613 Obrations 60 ANOVA of 55 Regression 1 17 Residual 56 2536 17 Total 6,200 Concordo meret 0.44 OM ma LA OLE NES 78.02 Regression MS 1,622.46 25.04 40 6538 Residual Total SS 4,867.37 56 1.402.41 59 626978 Coefficiente Standard Error 0.268 0.674 1.539 0.145 0.985 0.249 -0.900 0.162 P Star 0401 9240 Intercept 0 0 6 B SMB HML Stat 0.398 10.602 3.954 5.571