team of investment managers shall form portfolios of investments in 2 stocks according to the list below
Stocks : Boulder-Erskine
Portfolio X : 0.075
Portfolio Y : 0.078
Portfolio Z : 0.09
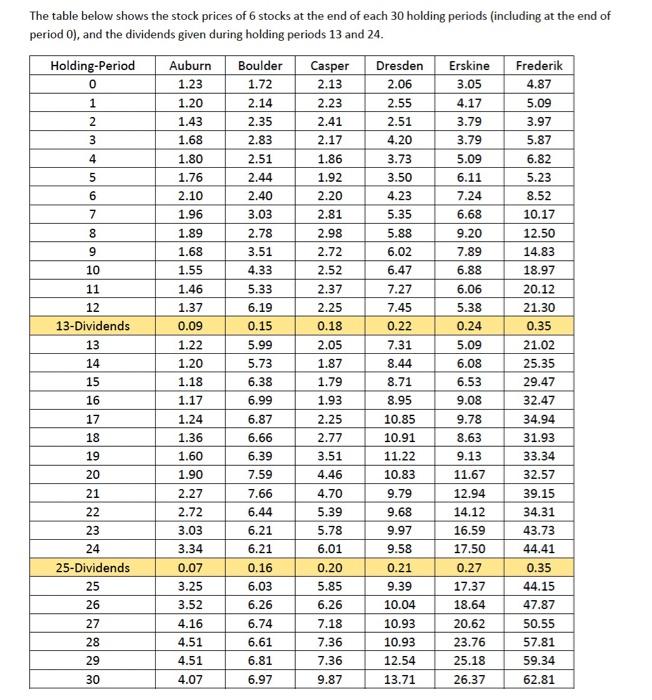
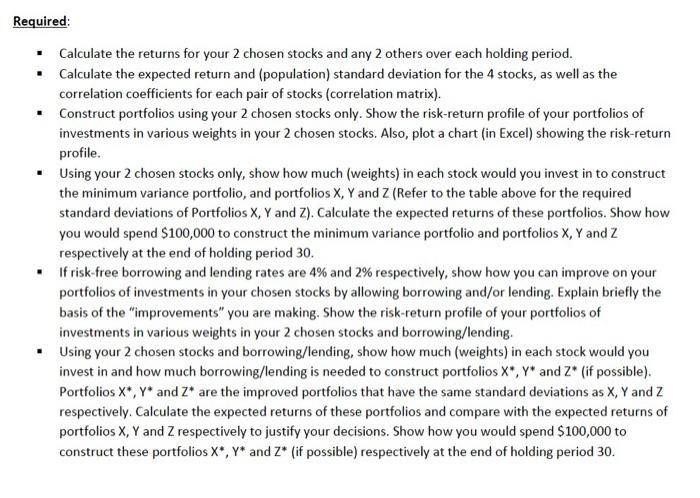
The table below shows the stock prices of 6 stocks at the end of each 30 holding periods (including at the end of period 0), and the dividends given during holding periods 13 and 24. Holding-Period 0 1 Auburn 1.23 1.20 1.43 1.68 1.80 Boulder 1.72 2.14 2.35 2.83 Casper 2.13 2.23 2.41 2 3 2.17 Erskine 3.05 4.17 3.79 3.79 5.09 6.11 7.24 6.68 2.51 4 5 6 7 9.20 7.89 1.76 2.10 1.96 1.89 1.68 1.55 1.46 1.37 0.09 1.22 1.20 Dresden 2.06 2.55 2.51 4.20 3.73 3.50 4.23 5.35 5.88 6.02 6.47 7.27 7.45 0.22 7.31 8.44 8.71 8.95 8 9 10 11 12 13-Dividends 13 14 15 6.88 Frederik 4.87 5.09 3.97 5.87 6.82 5.23 8.52 10.17 12.50 14.83 18.97 20.12 21.30 0.35 21.02 25.35 29.47 32.47 2.44 2.40 3.03 2.78 3.51 4.33 5.33 6.19 0.15 5.99 5.73 6.38 6.99 6.87 6.66 6.39 7.59 6.06 5.38 0.24 5.09 6.08 6.53 9.08 16 1.18 1.17 1.24 1.36 1.86 1.92 2.20 2.81 2.98 2.72 2.52 2.37 2.25 0.18 2.05 1.87 1.79 1.93 2.25 2.77 3.51 4.46 4.70 5.39 5.78 6.01 0.20 5.85 6.26 7.18 7.36 7.36 9.87 17 18 19 20 10.85 1.60 1.90 10.91 11.22 10.83 9.79 9.68 9.97 21 22 7.66 6.44 9.58 23 24 25-Dividends 25 26 2.27 2.72 3.03 3.34 0.07 3.25 3.52 4.16 4.51 4.51 4.07 6.21 6.21 0.16 6.03 6.26 9.78 8.63 9.13 11.67 12.94 14.12 16.59 17.50 0.27 17.37 18.64 20.62 23.76 25.18 26.37 34.94 31.93 33.34 32.57 39.15 34.31 43.73 44.41 0.35 44.15 47.87 50.55 57.81 59.34 62.81 0.21 9.39 10.04 27 6.74 6.61 6.81 10.93 10.93 28 29 12.54 13.71 30 6.97 Required: Calculate the returns for your 2 chosen stocks and any 2 others over each holding period. Calculate the expected return and (population) standard deviation for the 4 stocks, as well as the correlation coefficients for each pair of stocks (correlation matrix). Construct portfolios using your 2 chosen stocks only. Show the risk-return profile of your portfolios of investments in various weights in your 2 chosen stocks. Also, plot a chart (in Excel) showing the risk-return profile. . Using your 2 chosen stocks only, show how much (weights) in each stock would you invest in to construct the minimum variance portfolio, and portfolios X, Y and Z (Refer to the table above for the required standard deviations of Portfolios X, Y and Z). Calculate the expected returns of these portfolios. Show how you would spend $100,000 to construct the minimum variance portfolio and portfolios X, Y and Z respectively at the end of holding period 30. If risk-free borrowing and lending rates are 4% and 2% respectively, show how you can improve on your portfolios of investments in your chosen stocks by allowing borrowing and/or lending. Explain briefly the basis of the "improvements" you are making. Show the risk-return profile of your portfolios of investments in various weights in your 2 chosen stocks and borrowing/lending. . Using your 2 chosen stocks and borrowing/lending, show how much (weights) in each stock would you invest in and how much borrowing/lending is needed to construct portfolios X*, Y* and Z* (if possible). Portfolios X*, Y* and Z are the improved portfolios that have the same standard deviations as X, Y and Z respectively. Calculate the expected returns of these portfolios and compare with the expected returns of portfolios X, Y and Z respectively to justify your decisions. Show how you would spend $100,000 to construct these portfolios X*, Y* and Z* (if possible) respectively at the end of holding period 30. The table below shows the stock prices of 6 stocks at the end of each 30 holding periods (including at the end of period 0), and the dividends given during holding periods 13 and 24. Holding-Period 0 1 Auburn 1.23 1.20 1.43 1.68 1.80 Boulder 1.72 2.14 2.35 2.83 Casper 2.13 2.23 2.41 2 3 2.17 Erskine 3.05 4.17 3.79 3.79 5.09 6.11 7.24 6.68 2.51 4 5 6 7 9.20 7.89 1.76 2.10 1.96 1.89 1.68 1.55 1.46 1.37 0.09 1.22 1.20 Dresden 2.06 2.55 2.51 4.20 3.73 3.50 4.23 5.35 5.88 6.02 6.47 7.27 7.45 0.22 7.31 8.44 8.71 8.95 8 9 10 11 12 13-Dividends 13 14 15 6.88 Frederik 4.87 5.09 3.97 5.87 6.82 5.23 8.52 10.17 12.50 14.83 18.97 20.12 21.30 0.35 21.02 25.35 29.47 32.47 2.44 2.40 3.03 2.78 3.51 4.33 5.33 6.19 0.15 5.99 5.73 6.38 6.99 6.87 6.66 6.39 7.59 6.06 5.38 0.24 5.09 6.08 6.53 9.08 16 1.18 1.17 1.24 1.36 1.86 1.92 2.20 2.81 2.98 2.72 2.52 2.37 2.25 0.18 2.05 1.87 1.79 1.93 2.25 2.77 3.51 4.46 4.70 5.39 5.78 6.01 0.20 5.85 6.26 7.18 7.36 7.36 9.87 17 18 19 20 10.85 1.60 1.90 10.91 11.22 10.83 9.79 9.68 9.97 21 22 7.66 6.44 9.58 23 24 25-Dividends 25 26 2.27 2.72 3.03 3.34 0.07 3.25 3.52 4.16 4.51 4.51 4.07 6.21 6.21 0.16 6.03 6.26 9.78 8.63 9.13 11.67 12.94 14.12 16.59 17.50 0.27 17.37 18.64 20.62 23.76 25.18 26.37 34.94 31.93 33.34 32.57 39.15 34.31 43.73 44.41 0.35 44.15 47.87 50.55 57.81 59.34 62.81 0.21 9.39 10.04 27 6.74 6.61 6.81 10.93 10.93 28 29 12.54 13.71 30 6.97 Required: Calculate the returns for your 2 chosen stocks and any 2 others over each holding period. Calculate the expected return and (population) standard deviation for the 4 stocks, as well as the correlation coefficients for each pair of stocks (correlation matrix). Construct portfolios using your 2 chosen stocks only. Show the risk-return profile of your portfolios of investments in various weights in your 2 chosen stocks. Also, plot a chart (in Excel) showing the risk-return profile. . Using your 2 chosen stocks only, show how much (weights) in each stock would you invest in to construct the minimum variance portfolio, and portfolios X, Y and Z (Refer to the table above for the required standard deviations of Portfolios X, Y and Z). Calculate the expected returns of these portfolios. Show how you would spend $100,000 to construct the minimum variance portfolio and portfolios X, Y and Z respectively at the end of holding period 30. If risk-free borrowing and lending rates are 4% and 2% respectively, show how you can improve on your portfolios of investments in your chosen stocks by allowing borrowing and/or lending. Explain briefly the basis of the "improvements" you are making. Show the risk-return profile of your portfolios of investments in various weights in your 2 chosen stocks and borrowing/lending. . Using your 2 chosen stocks and borrowing/lending, show how much (weights) in each stock would you invest in and how much borrowing/lending is needed to construct portfolios X*, Y* and Z* (if possible). Portfolios X*, Y* and Z are the improved portfolios that have the same standard deviations as X, Y and Z respectively. Calculate the expected returns of these portfolios and compare with the expected returns of portfolios X, Y and Z respectively to justify your decisions. Show how you would spend $100,000 to construct these portfolios X*, Y* and Z* (if possible) respectively at the end of holding period 30