TED AND ALICES HOUSE PURCHASE DECISION Ted and Alice are a young couple who have been living in an apartment for the first two years
TED AND ALICE’S HOUSE PURCHASE DECISION
Ted and Alice are a young couple who have been living in an apartment for the first two years of their marriage. They would like to buy their first house, but do not know whether they can afford it. Ted works as a carpenter’s apprentice, and Alice is a customer service specialist at a local bank. In 2013, Ted’s “take home” wages were $24,000 after taxes and deductions, and Alice’s take-home salary was $30,000. Ted gets a 2% raise every year, and Alice gets a 3% raise. Their apartment rent is $1,200 per month ($14,400 per year), but the lease is up for renewal and the landlord said he needs to increase the rent for the next lease.
Ted and Alice have been looking at houses and have found one they can buy, but they will need to borrow $200,000 for a mortgage. Their parents are helping them with the down payment and closing costs. After talking to several lenders, Ted and Alice have learned that the state legislature is voting on a first-time home buyers’ mortgage bond. If the bill passes, they will be able to get a 30-year fixed mortgage at 3% interest. Otherwise, they will have to pay 6% interest on the mortgage.
Because of the depressed housing market, Ted and Alice are not figuring equity value into their calculations. In addition, although the mortgage interest and real estate taxes will be deductible on their income taxes, these deductions will not be higher than the standard allowable tax deduction, so they are not figuring on any savings there either. Ted and Alice’s other living expenses (such as car payments, food, and medical bills), the utilities expenses for either renting or buying, and estimated house maintenance expenses are listed in the Constants section (see Figure C-32).
Ted and Alice’s primary concern is their cash on hand at the end of years 2014 and 2015. They are thinking of starting a family, but they know it will be difficult without adequate savings.
Getting Started on the Practice Exercise
If you closed Excel after the first tutorial exercise, start Excel again—it will automatically open a new workbook for you. If your Excel workbook from the first tutorial is still open, you may find it useful to start a new worksheet in the same workbook. Then you can refer back to the first tutorial when you need to structure or format the spreadsheet; the formatting of both exercises in this tutorial is similar. Set up your new worksheet as explained in the following sections.
Constants Section
Your spreadsheet should have the constants shown in Figure C-32. An explanation of the line items follows the figure.

Source: Used with permission from Microsoft Corporation
FIGURE C-32 Constants section
• Non-Housing Living Expenses—This value represents Ted and Alice’s estimate of all their other living expenses for 2014 and 2015.
• Mortgage Amount for Home Purchase
• Real Estate Taxes and Insurance on Home—A lender has given Ted and Alice estimates for these values; they are usually paid monthly with the house mortgage payment. The money is placed in an escrow account and then paid by the mortgage company to the state or county and insurance company.
• Utilities Expense—Apartment—This value is Ted and Alice’s estimate for 2014 and 2015 based on their 2013 bills.
• Utilities Expense—House—Currently the apartment rent includes fees for water, sewer, and trash disposal. If they get a house, Ted and Alice expect the utilities to be higher.
• House Repair and Maintenance Expenses—In an apartment, the landlord is responsible for repair and maintenance. Ted and Alice will have to budget for repair and maintenance on the house.
Inputs Section
Your spreadsheet should have the inputs shown in Figure C-33. An explanation of line items follows the figure.

Source: Used with permission from Microsoft Corporation
FIGURE C-33 Inputs section
• Rental Occupancy (H=High, L=Low)—When the housing market is depressed (in other words, people are not buying homes), rental housing occupancy percentages are high, which allows landlords to charge higher rents when leases are renewed. Ted and Alice think their rent will increase in 2014. The amount of the increase depends on the Rental Occupancy. If the occupancy is high, Ted and Alice expect to see a 10% increase in rent in both 2014 and 2015. If occupancy is low, they only expect a 3% increase for each year.
• First Time Buyer Bond Loans Available (Y=Yes, N=No)—As described earlier, when housing markets are depressed, local governments will frequently pass a bond bill to provide low-interest mortgage money to first-time home buyers. If the bond loans are available, Ted and Alice can obtain a 30-year fixed mortgage at only 3%, which is half the interest rate they would otherwise pay for a conventional mortgage.
Summary of Key Results Section
Figure C-34 shows what key results Ted and Alice are looking for. They want to know their End-of-year Cash on Hand for both 2014 and 2015 if they decide to stay in the apartment and if they decide to purchase the house.

Source: Used with permission from Microsoft Corporation
FIGURE C-34 Summary of Key Results section
These results are copied from the End-of-year Cash on Hand sections of the Income and Cash Flow Statements sections (for both renting and buying).
Calculations Section
Your spreadsheet will need formulas to calculate the apartment rent, house payments, and interest rate for the mortgage (see Figure C-35). You will use the rent and house payments later in the Income and Cash Flow Statements for both renting and buying.

Source: Used with permission from Microsoft Corporation
FIGURE C-35 Calculations section
• Apartment Rent—The 2013 amount is given. Use IF formulas to increase the rent by 10% if occupancy rates are high, or by 3% if occupancy rates are low.
• House Payments—This value is the total of the 12 monthly payments made on the mortgage. An important point to note is that house mortgage interest is always compounded monthly, not annually, as in the thrift shop tutorial. To properly calculate the house payments for the year, you divide the annual interest rate by 12 to determine the monthly interest. You also have to multiply a 30-year mortgage by 12 to get 360 payments, and then multiply the PMT formula by 12 to get the total amount for your annual house payments. Also, you will precede the PMT function with a negative sign to make the payment amount a positive number. Your formula should look like the following:
=–PMT(B22/12,360,C5)*12
• Interest Rate for House Mortgage—Use the IF formula to enter a 3% interest rate if the bond money is available, and a 6% interest rate if no bond money is available.
Income and Cash Flow Statements Sections
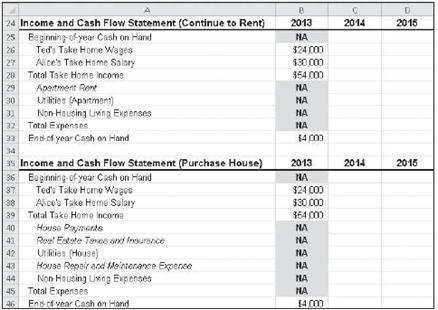
As with the thrift shop tutorial, you want to see the Income and Cash Flow Statements for two scenarios—in this case, for continuing to rent and for purchasing a house. Each section begins with cash on hand at the end of 2013. As you can see in Figure C-36, Ted and Alice have only $4,000 in their savings.

Source: Used with permission from Microsoft Corporation
FIGURE C-36 Income and Cash Flow Statements sections (for both rent and purchase)
• Beginning-of-year Cash on Hand—This value is the End-of-year Cash on Hand from the previous year.
• Ted’s Take Home Wages—This value is given for 2013. To get values for 2014 and 2015, increase Ted’s wages by 2% each year.
• Alice’s Take Home Salary—This value is given for 2013. To get values for 2014 and 2015, increase Alice’s salary by 3% each year.
• Total Take Home Income—The sum of Ted and Alice’s pay.
• Apartment Rent—The rent is copied from the Calculations section.
• House Payments—The house payments are also copied from the Calculations section.
• Real Estate Taxes and Insurance, Utilities (Apartment or House), House Repair and Maintenance Expense, and Non-Housing Living Expenses—These values all are copied from the Constants section.
• Total Expenses—This value is the sum of all the expenses listed above. Note that the house payment is now a positive number, so you can sum it normally with the other expenses.
• End-of-year Cash on Hand—This value is the Beginning-of-year Cash on Hand plus the Total Take Home Income minus the Total Expenses.
Scenario Manager Analysis
When you have completed the spreadsheet, set up Scenario Manager and create a Scenario Summary sheet. Ted and Alice want to look at their End-of-year Cash on Hand in 2015 for renting or buying under the following four scenarios:
• High occupancy and bond money available
• High occupancy and no bond money available
• Low occupancy and bond money available
• Low occupancy and no bond money available
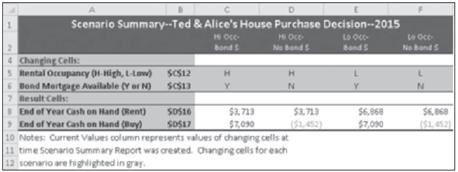
If you have done your spreadsheet and Scenario Manager correctly, you should get the results shown in Figure C-37.

Source: Used with permission from Microsoft Corporation
FIGURE C-37 Scenario Summary results
Interpreting the Results
Based on the Scenario Summary results, what should Ted and Alice do? At first glance, it looks like the safe decision is to stay in the apartment. Actually, their decision hinges on whether they can get the lower-interest mortgage from the first-time buyers’ bond issue. If they can, and if occupancy levels in apartments stay high, purchasing a house will give them about $3,300 more in savings at the end of 2015 than if they continued renting. Some other intangible factors are that home owners do not need permission to have pets, detached houses are quieter than apartments, and homes usually have a yard for pets and children to play in. Also, for the purposes of this exercise, you did not consider the tax benefits of home ownership. Depending on the amount of mortgage interest and real estate taxes Ted and Alice have to pay, they may be able to itemize their deductions and pay less income tax. If the income tax savings are more than $1,500, they can purchase the house even at the higher interest rate. In any case, because you did the DSS model for them, Ted and Alice now have a quantitative basis to help them make a good decision.
Visual Impact: Charting the Results
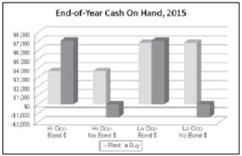
Charts and graphs often add visual impact to a Scenario Summary. Using the data from the Scenario Summary output table, try to create a chart similar to the one in Figure C-38 to illustrate the financial impact of each outcome.

Source: Used with permission from Microsoft Corporation
FIGURE C-38 A 3-D clustered column chart created from Scenario Summary data
C Tutorial Exercise Skeleton-Ted and Alice's House Decision 3 Constants Non-Housing Living Expenses (Cars, Food, Medical, etc) Mortgage Amount for Home Purchase Real Estate Taxes and Insurance on Home Utilities Expense Oleat & Electric)-Apartment Utilities Expensagear, Electric, Water, Trash)-House House Repair and Maintenance Expenses 2013 NA NA NA NA NA NA 2014 $36,000 $200,000 $3,000 12,000 $2.500 $1,200 D 2015 139,000 NA $3,150 $2,200 $2,600 $1,400
Step by Step Solution
3.49 Rating (149 Votes )
There are 3 Steps involved in it
Step: 1

See step-by-step solutions with expert insights and AI powered tools for academic success
Step: 2

Step: 3

Ace Your Homework with AI
Get the answers you need in no time with our AI-driven, step-by-step assistance
Get Started


