TeleTech Corporation, 2005
1. How does the choice of constant vs. risk-adjusted hurdle rates affect the evaluation of Tele-Techs two segments? What are the implications for Tele-Techs resource allocation strategy?
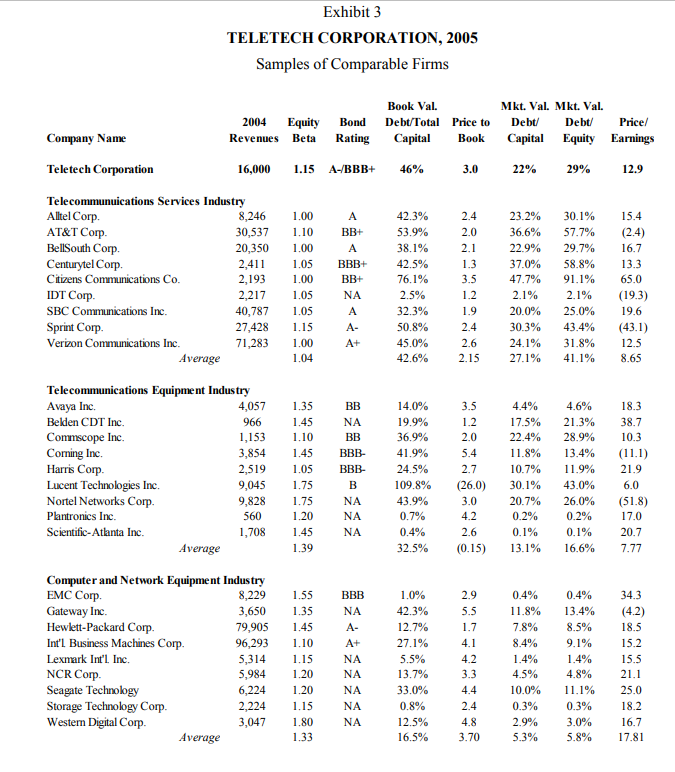
2. Please estimate segment WACC for Tele-Tech. Note that the capital structure weights of each segments is approximately equal to the average of comparable firms in Exh.3.
3. If Tele-Tech began allocating capital on the basis of risk-adjusted hurdle rate, would it destroy value? Has Products and Systems destroyed value? Should Tele-Tech implement the risk-adjusted hurdle rate system?
4. Briefly conjecture on the likely barriers for the implementation of the risk-adjusted hurdle rate system.
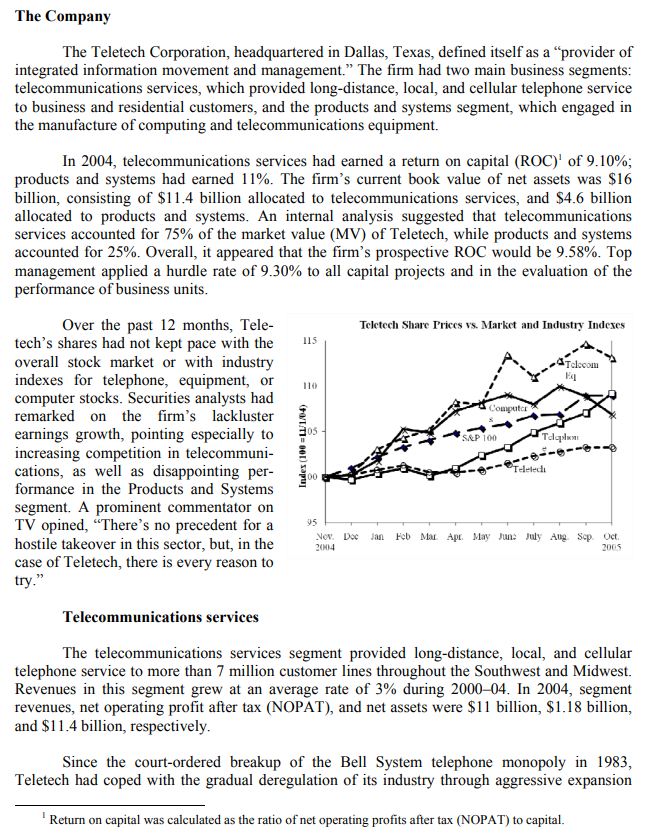
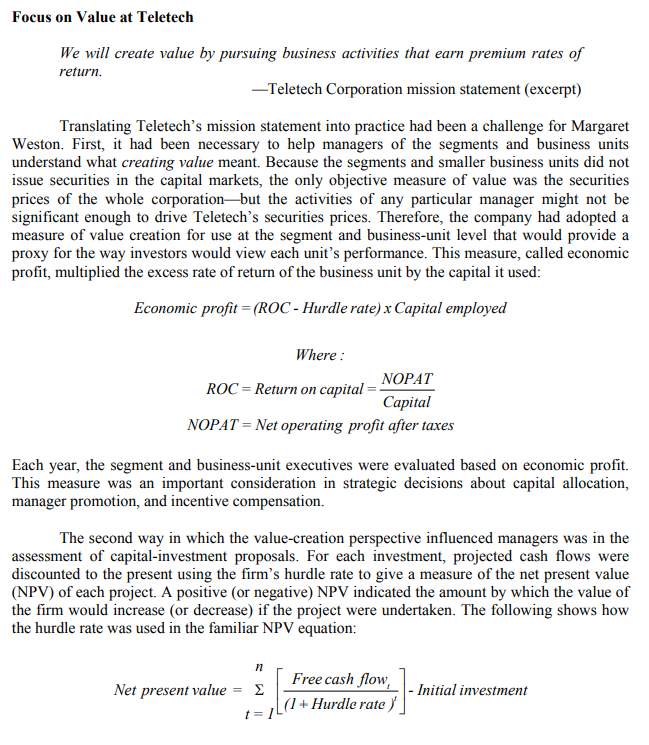
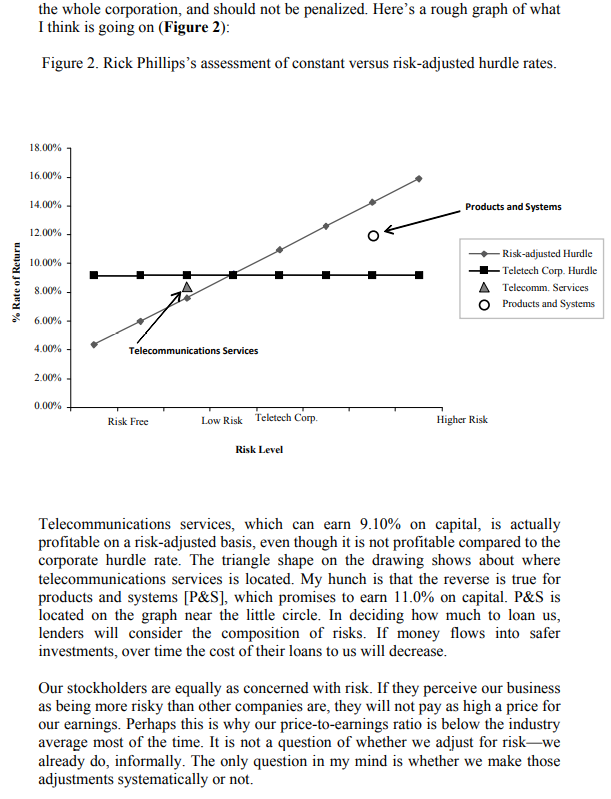
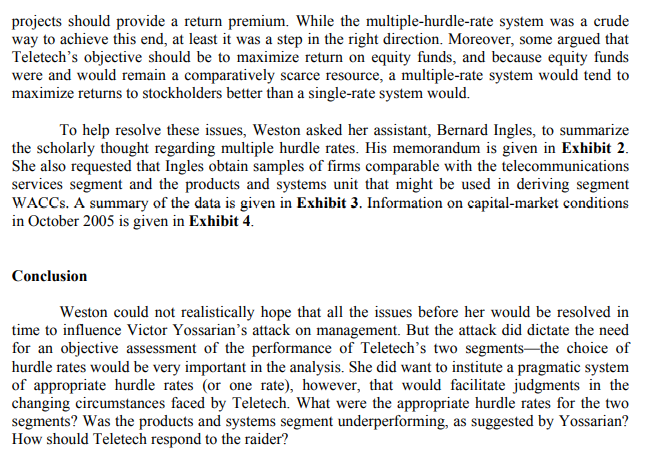
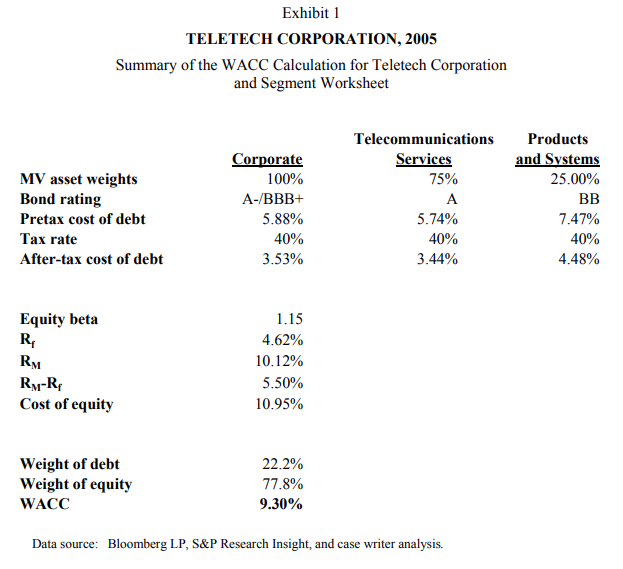
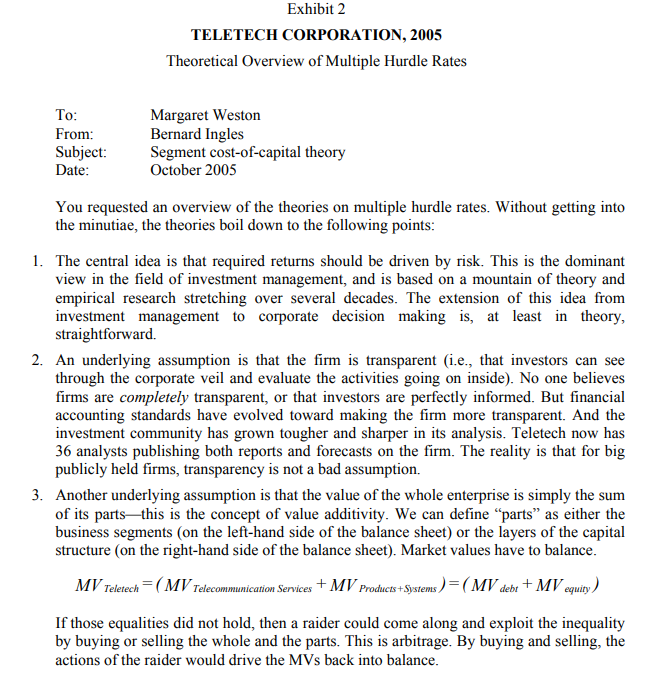
TELETECH CORPORATION, 2005 Margaret Weston, Teletech Corporation's CFO, learned of Victor Yossarian's letter late one evening in early October 2005. Quickly, she organized a team of lawyers and finance staff to assess the threat. Maxwell Harper, the firm's CEO, scheduled a teleconference meeting of the firm's board of directors for the following afternoon. Harper and Weston agreed that before the meeting they needed to fashion a response to Yossarian's assertions about the firm's returns. Raider Dials Teletech "Wake-Up Call Needed," Says Investor New York-The reclusive billionaire Victor Yossarian has acquired a 10 percent stake in Teletech Corporation, a large regional telecommunications firm, and has demanded two seats on the firm's board of directors. The purchase was revealed yesterday in a filing with the Securities and Exchange Commission, and separately in a letter to Teletech's CEO, Maxwell Harper. "The firm is misusing its resources and not earning an adequate return," the letter said. "The company should abandon its misguided entry into computers, and sell its Product and Systems segment. Management must focus on creating value for shareholders." Teletech issued a brief statement emphasizing the virtues of a link between computer technology and telecommunications Wall Street Daily News, October 15, 2005. Ironically, returns had been the subject of debate within the firm's circle of senior managers in recent months. A number of issues had been raised about the hurdle rate used by the company when evaluating performance and setting the firm's annual capital budget. As the company was expected to invest nearly $2 billion in capital projects in the coming year, gaining closure and consensus on those issues had become an important priority for Weston. Now, Yossarian's letter lent urgency to the discussion In the short run, Weston needed to respond to Yossarian. In the long run, she needed to assess the competing viewpoints on Teletech's returns, and she had to recommend new policies as necessary. What should the hurdle rates be for Teletech's two business segments, telecommunications services and its newer products and systems unit? Was the products and systems segment really paying its way? The Company The Teletech Corporation, headquartered in Dallas, Texas, defined itself as a provider of integrated information movement and management." The firm had two main business segments: telecommunications services, which provided long-distance, local, and cellular telephone service to business and residential customers, and the products and systems segment, which engaged in the manufacture of computing and telecommunications equipment. In 2004, telecommunications services had earned a return on capital (ROC)' of 9.10%; products and systems had earned 11%. The firm's current book value of net assets was $16 billion, consisting of $11.4 billion allocated to telecommunications services, and $4.6 billion allocated to products and systems. An internal analysis suggested that telecommunications services accounted for 75% of the market value (MV) of Teletech, while products and systems accounted for 25%. Overall, it appeared that the firm's prospective ROC would be 9.58%. Top management applied a hurdle rate of 9.30% to all capital projects and in the evaluation of the performance of business units. Over the past 12 months, Tele- Teletech Share Prices vs. Market and Industry Indexes tech's shares had not kept pace with the 115 overall stock market or with industry indexes for telephone, equipment, or computer stocks. Securities analysts had remarked on the firm's lackluster earnings growth, pointing especially to increasing competition in telecommuni- cations, as well as disappointing per- formance in the Products and Systems segment. A prominent commentator on TV opined, "There's no precedent for a hostile takeover in this sector, but, in the Nov Dec Jan Feb Mar Apr May June July Aug Sep Oct case of Teletech, there is every reason to try. Telecom EL Computer os SAP 100 Tellum (1/1000) sapu Teleted 95 2014 Telecommunications services The telecommunications services segment provided long-distance, local, and cellular telephone service to more than 7 million customer lines throughout the Southwest and Midwest. Revenues in this segment grew at an average rate of 3% during 2000-04. In 2004, segment revenues, net operating profit after tax (NOPAT), and net assets were $11 billion, $1.18 billion, and $11.4 billion, respectively. Since the court-ordered breakup of the Bell System telephone monopoly in 1983, Teletech had coped with the gradual deregulation of its industry through aggressive expansion Return on capital was calculated as the ratio of net operating profits after tax (NOPAT) to capital. into new services and geographical regions. Most recently, the firm had been a leading bidder for cellular telephone operations and for licenses to offer personal communications services (PCS). In addition, the firm had purchased a number of telephone-operating companies through privatization auctions in Latin America. Finally, the firm had invested aggressively in new technology-primarily, digital switches and optical-fiber cablesin an effort to enhance its service quality. All of those strategic moves had been costly: the capital budget in this segment had varied between $1.5 billion and $2 billion in each of the previous 10 years. Unfortunately, profit margins in the telecommunications segment had been under pressure for several years. Government regulators had been slow to provide rate relief to Teletech for its capital investments. Other leading telecommunications providers had expanded into Teletech's geographical markets and invested in new technology and quality-enhancing assets. Teletech's management noted that large cable-TV companies had aggressively entered the telecommunications market and continued the pressure on profit margins. Nevertheless, Teletech was the dominant service provider in its geographical markets and product segments. Customer surveys revealed that the company was the leader in product quality and customer satisfaction. Its management was confident that the company could command premium prices no matter how the industry might evolve. Products and systems Before 2000, telecommunications had been the company's core business, supplemented by an equipment manufacturing division that produced telecommunications components. In 2000, the company acquired a leading computer-workstation manufacturer with the goal of applying state-of-the-art computing technology to the design of telecommunications equipment. The explosive growth in the microcomputer market and the increased usage of telephone lines to connect home- and office-based computers with mainframes convinced Teletech's management of the potential value of marrying telecommunications equipment with computing technology. Using Teletech's capital base, borrowing ability, and distribution network to catapult growth, the products and systems segment increased its sales by nearly 40% in 2004. This segment's 2004 NOPAT and net assets were $480 million and $4.6 billion, respectively. The products and systems segment was acknowledged as a technology leader in the industry. While this accounted for its rapid growth and pricing power, maintenance of that leadership position required sizable investments in research and development (R&D) and fixed assets. The rate of technological change was increasing, as witnessed by sudden major write-offs by Teletech on products that, until recently, management had thought were still competitive. Major computer manufacturers were entering the telecommunications-equipment industry. Foreign manufacturers were proving to be stiff competition for bidding on major supply contracts. Focus on Value at Teletech We will create value by pursuing business activities that earn premium rates of return. - Teletech Corporation mission statement (excerpt) Translating Teletech's mission statement into practice had been a challenge for Margaret Weston. First, it had been necessary to help managers of the segments and business units understand what creating value meant. Because the segments and smaller business units did not issue securities in the capital markets, the only objective measure of value was the securities prices of the whole corporationbut the activities of any particular manager might not be significant enough to drive Teletech's securities prices. Therefore, the company had adopted a measure of value creation for use at the segment and business-unit level that would provide a proxy for the way investors would view each unit's performance. This measure, called economic profit, multiplied the excess rate of return of the business unit by the capital it used: Economic profit =(ROC- Hurdle rate) x Capital employed Where: NOPAT ROC = Return on capital Capital NOPAT = Net operating profit after taxes Each year, the segment and business-unit executives were evaluated based on economic profit. This measure was an important consideration in strategic decisions about capital allocation, manager promotion, and incentive compensation. The second way in which the value-creation perspective influenced managers was in the assessment of capital-investment proposals. For each investment, projected cash flows were discounted to the present using the firm's hurdle rate to give a measure of the net present value (NPV) of each project. A positive (or negative) NPV indicated the amount by which the value of the firm would increase or decrease) if the project were undertaken. The following shows how the hurdle rate was used in the familiar NPV equation: n Net present value Free cash flow, (1 + Hurdle rate) - Initial investment 1 = 1 Hurdle Rates The hurdle rate used in the assessments of economic profit and NPV had been the focus of considerable debate in recent months. This rate was based on an estimate of Teletech's weighted average cost of capital (WACC). Management was completely satisfied with the intellectual relevance of a hurdle rate as an expression of the opportunity cost of money. The notion that the WACC represented this opportunity cost had been hotly debated within the company, and while its measurement had never been considered wholly scientific, it was generally accepted. Teletech was split-rated between A- and BBB+. An investment banker recently suggested that at those ratings, new debt funds might cost Teletech 5.88% (about 3.53% after a 40% tax rate). With a beta of 1.15, the cost of equity might be about 10.95%. At market value weights of 22% for debt and 78% for equity, the resulting WACC would be 9.30%. Exhibit 1 summarizes the calculation. The hurdle rate of 9.30% was applied to all investment and performance-measurement analyses at the firm. Arguments for risk-adjusted hurdle rates How the rate should be used within the company in evaluating projects was another point of debate. Given the differing natures of the two businesses and the risks each one faced, differences of opinion arose at the segment level over the appropriateness of measuring all projects against the corporate hurdle rate of 9.30%. The chief advocate for multiple rates was Rick Phillips, executive vice president of telecommunications services, who presented his views as follows: Each phase of our business is different. They must compete differently and must draw on capital differently. Given the historically stable nature of this industry, many telecommunications companies can raise large quantities of capital from the debt markets. In operations comparable to telecommunications services, 50% of the necessary capital is raised in the debt markets at interest rates reflecting solid A quality, on average. This is better than Teletech's corporate bond rating of A-/BBB+. I also have to believe that the cost of equity for telecommunications services is lower than it is for products and systems. Although the products and systems segment's sales growth and profitability have been strong, its risks are high. Independent equipment manufacturers are financed with higher-yielding BB-rated debt and a greater proportion of equity. In my book, the hurdle rate for products and systems should reflect those higher costs of funds. Without the risk-adjusted system of hurdle rates, telecommunications services will gradually starve for capital, while products and systems will be force-fed-that's because our returns are less than the corporate hurdle rate, and theirs are greater. Telecommunications services lowers the risk of the whole corporation, and should not be penalized. Here's a rough graph of what I think is going on (Figure 2): Figure 2. Rick Phillips's assessment of constant versus risk-adjusted hurdle rates. 18.00% 16.00% 14.00% Products and Systems 12.00% 10.00% % Rate of Return Risk-adjusted Hurdle - Teletech Corp. Hurdle A Telecomm. Services O Products and Systems 8.00% 6.00% 4.00% Telecommunications Services 2.00% 0.00% Risk Free Low Risk Teletech Corp. Higher Risk Risk Level Telecommunications services, which can earn 9.10% on capital, is actually profitable on a risk-adjusted basis, even though it is not profitable compared to the corporate hurdle rate. The triangle shape on the drawing shows about where telecommunications services is located. My hunch is that the reverse is true for products and systems [P&S], which promises to earn 11.0% on capital. P&S is located on the graph near the little circle. In deciding how much to loan us, lenders will consider the composition of risks. If money flows into safer investments, over time the cost of their loans to us will decrease. Our stockholders are equally as concerned with risk. If they perceive our business as being more risky than other companies are, they will not pay as high a price for our earnings. Perhaps this is why our price-to-earnings ratio is below the industry average most of the time. It is not a question of whether we adjust for risk-we already do, informally. The only question in my mind is whether we make those adjustments systematically or not. While multiple hurdle rates may not reflect capital-structure changes on a day-to- day basis, over time they will reflect prospects more realistically. At the moment, as I understand it, our real problem is an inadequate and very costly supply of equity funds. If we are really rationing equity capital, then we should be striving for the best returns on equity for the risk. Multiple hurdle rates achieve that objective. Implicit in Phillips's argument, as Weston understood it, was the notion that if each segment in the company had a different hurdle rate, the costs of the various forms of capital would remain the same. The mix of capital used, however, would change in the calculation. Low-risk operations would use leverage more extensively, while the high-risk divisions would have little to no debt funds. This lower-risk segment would have a lower hurdle rate. Opposition to risk-adjusted hurdle rates While several others within Teletech supported Phillips's views, opposition was strong within the products and systems segment. Helen Buono, executive vice president of products and systems, expressed her opinion as follows: All money is green. Investors can't know as much about our operations as we do. To them the firm is a black box, they hire us to take care of what is inside the box, and judge us by the dividends coming out of the box. We can't say that one part of the box has a different hurdle rate than another part of the box if our investors don't think that way. Like I say, all money is green: all investments at Teletech should be judged against one hurdle rate. Multiple hurdle rates are illogical Suppose that the hurdle rate for telecommunications services was much lower than the corporate-wide hurdle rate. If we undertook investments that met the segment hurdle rate, we would be destroying shareholder value because we weren't meeting the corporate hurdle rate. Our job as managers should be to put our money where the returns are best. A single hurdle rate may deprive an under profitable division of investments in order to channel more funds into a more profitable division, but isn't that the aim of the process? Our challenge today is simple: we must earn the highest absolute rates of return that we can get. In reality, we don't finance each division separately. The corporation raises capital based on its overall prospects and record. The diversification of the company probably helps keep our capital costs down and enables us to borrow more in total than the sum of the capabilities of the divisions separately. As a result, developing separate hurdle rates is both unrealistic and misleading. All our stockholders want is for us to invest our funds wisely in order to increase the value of their stock. This happens when we pick the most promising projects, irrespective of the source. Margaret Weston's Concerns As Weston listened to these arguments, presented over the course of several months, she became increasingly concerned about several related considerations. First, Teletech's corporate strategy had directed the company toward integrating the two segments. One effect of using multiple hurdle rates would be to make justifying high-technology research and application proposals more difficult, as the required rate of return would be increased. On the one hand, she thought, perhaps multiple hurdle rates were the right idea, but the notion that they should be based on capital costs rather than strategic considerations might be wrong. On the other hand, perhaps multiple rates based on capital costs should be used, but, in allocating funds, some qualitative adjustment should be made for unquantifiable strategic considerations. In Weston's mind, the theory was certainly not clear on how to achieve strategic objectives when allocating capital. Second, using a single measure of the cost of money (the hurdle rate or discount factor) made the NPV results consistent, at least in economic terms. If Teletech adopted multiple rates for discounting cash flows, Weston was afraid that the NPV and economic-profit calculations would lose their meaning and comparability across business segments. To her, a performance criterion had to be consistent and understandable, or it would not be useful. In addition, Weston was concerned about the problem of attributing capital structures to divisions. In the telecommunications services segment, a major new switching station might be financed by mortgage bonds. In products and systems, however, it was impossible for the division to borrow directly; indeed, any financing was only feasible because the corporation guaranteed the debt. Such projects were considered highly riskyat best, perhaps, warranting only a minimal debt structure. Also, Weston considered the debt-capacity decision difficult enough for the corporation as a whole, let alone for each division. Judgments could only be very crude. In further discussions with others in the organization about the use of multiple hurdle rates, Weston discovered two predominant themes. One argument held that investment decisions should never be mixed with financing decisions. A firm should first decide what its investments should be and then determine how to finance them most efficiently. Adding leverage to a present-value calculation would distort the results. The use of multiple hurdle rates was simply a way of mixing financing with investment analysis. This argument also held that a single rate made the risk decision clear-cut. Management could simply adjust its standard (NPV or economic profit) as the risks increased. The contrasting line of reasoning noted that the WACC tended to represent an average market reaction to a mixture of risks. Lower-than-average-risk projects should probably be accepted even when they did not meet the weighted-average criterion. Higher-than-normal-risk projects should provide a return premium. While the multiple-hurdle-rate system was a crude way to achieve this end, at least it was a step in the right direction. Moreover, some argued that Teletech's objective should be to maximize return on equity funds, and because equity funds were and would remain a comparatively scarce resource, a multiple-rate system would tend to maximize returns to stockholders better than a single-rate system would. To help resolve these issues, Weston asked her assistant, Bernard Ingles, to summarize the scholarly thought regarding multiple hurdle rates. His memorandum is given in Exhibit 2. She also requested that Ingles obtain samples of firms comparable with the telecommunications services segment and the products and systems unit that might be used in deriving segment WACCs. A summary of the data is given in Exhibit 3. Information on capital-market conditions in October 2005 is given in Exhibit 4. Conclusion Weston could not realistically hope that all the issues before her would be resolved in time to influence Victor Yossarian's attack on management. But the attack did dictate the need for an objective assessment of the performance of Teletech's two segmentsthe choice of hurdle rates would be very important in the analysis. She did want to institute a pragmatic system of appropriate hurdle rates (or one rate), however, that would facilitate judgments in the changing circumstances faced by Teletech. What were the appropriate hurdle rates for the two segments? Was the products and systems segment underperforming, as suggested by Yossarian? How should Teletech respond to the raider? Exhibit 1 TELETECH CORPORATION, 2005 Summary of the WACC Calculation for Teletech Corporation and Segment Worksheet MV asset weights Bond rating Pretax cost of debt Tax rate After-tax cost of debt Corporate 100% A-/BBB+ 5.88% 40% 3.53% Telecommunications Services 75% A 5.74% 40% 3.44% Products and Systems 25.00% BB 7.47% 40% 4.48% Equity beta R RM 1.15 4.62% 10.12% 5.50% 10.95% RM-R Cost of equity Weight of debt Weight of equity WACC 22.2% 77.8% 9.30% Data source: Bloomberg LP, S&P Research Insight, and case writer analysis. Exhibit 2 TELETECH CORPORATION, 2005 Theoretical Overview of Multiple Hurdle Rates To: From: Subject: Date: Margaret Weston Bernard Ingles Segment cost-of-capital theory October 2005 You requested an overview of the theories on multiple hurdle rates. Without getting into the minutiae, the theories boil down to the following points: 1. The central idea is that required returns should be driven by risk. This is the dominant view in the field of investment management, and is based on a mountain of theory and empirical research stretching over several decades. The extension of this idea from investment management to corporate decision making is, at least in theory, straightforward. 2. An underlying assumption is that the firm is transparent (i.e., that investors can see through the corporate veil and evaluate the activities going on inside). No one believes firms are completely transparent, or that investors are perfectly informed. But financial accounting standards have evolved toward making the firm more transparent. And the investment community has grown tougher and sharper in its analysis. Teletech now has 36 analysts publishing both reports and forecasts on the firm. The reality is that for big publicly held firms, transparency is not a bad assumption. 3. Another underlying assumption is that the value of the whole enterprise is simply the sum of its partsthis is the concept of value additivity. We can define parts as either the business segments on the left-hand side of the balance sheet) or the layers of the capital structure on the right-hand side of the balance sheet). Market values have to balance. MV Teletech = ( MV Telecommunication Services + MV Products +-Systems ) = ( MV debe + MV equity) If those equalities did not hold, then a raider could come along and exploit the inequality by buying or selling the whole and the parts. This is arbitrage. By buying and selling, the actions of the raider would drive the MVs back into balance. Exhibit 2 (continued) 4. Investment theory tells us that the only risk that matters is nondiversifiable risk, which is measured by beta. Beta indicates the risk that an asset will add to a portfolio. Since we assume that an investor is diversified, we also assume she seeks a return for only the risk that she cannot shed, which is the nondiversifiable risk. The important point here is that the beta of a portfolio is equal to a weighted average of the betas of the portfolio components. Extending this to the corporate environment, the asset beta for the firm will equal a weighted average of the components of the firm-again, the components of the firm can be defined in terms of either the right-hand side or the left-hand side of the balance sheet Preletech Assets = (W Tel.Serv. Prel. Serv. + Wp+s Bp+s) = (Welebe Belebe + Wequiry equity) Where: w = percentage weights based on market values. Brel ServBpts = Asset betas for business segments. Bdebe = B for the firm's debt securities. Bequiry = Bof firm's common stock (given by Bloomberg, etc.) This is a very handy way to model the risk of the firm, for it means that we can use the capital asset pricing model to estimate the cost of capital for a segment (i.e., using segment asset betas). 5. Given the foregoing, it follows that the weighted average of the various costs of capital (K) for the firm (WACC), which is the theoretically correct hurdle rate, is simply a weighted average of segment WACCs: WACC Teletech = (Wrel, Ser: WACC Tel Serv) + (WP+SWACCP+s) Where: percentage weights based on market values. W WACC rel. Serv. = W debt, Tel. Serv. K debe, Tel. Serv) + (Wequity. Tel. Serv. K equity, Vel. Serv) WACCP+S = (W debt, P+S K deb, P+S) + (Wequity, P+S K equity, P+) Exhibit 2 (continued) 6. The notion in point number 5 may not hold exactly in practice. First, most of the components in the WACC formula are estimated with some error. Second, because of taxes, information asymmetries, or other market imperfections, assets may not be priced strictly in line with the modelfor a company like Teletech, it is reasonable to assume that any mispricings are just temporary. Third, the simple two-segment characterization ignores a hidden third segment: the corporate treasury department that hedges and aims to finance the whole corporation optimally-this acts as a shock absorber for the financial policies of the segments. Modeling the WACC of the corporate treasury department is quite difficult. Most companies assume that the impact of corporate treasury is not very large, and simply assume it away. As a first cut, we could do this too, although it is an issue we should revisit Conclusions In theory, the corporate WACC for Teletech is appropriate only for evaluating an asset having the same risk as the whole company. It is not appropriate for assets having different risks than the whole company. Segment WACCs are computed similarly to corporate WACCs. In concept, the corporate WACC is a weighted average of the segment WACCs. In practice, the weighted average concept may not hold, due to imperfections in the market and/or estimation errors. If we start computing segment WACCs, we must use the cost of debt, cost of equity, and the weights appropriate to that segment. We need a lot of information to do this correctly, or else we really need to stretch to make assumptions. Exhibit 3 TELETECH CORPORATION, 2005 Samples of Comparable Firms Book Val. 2004 Equity Bond Debt/Total Price to Revenues Beta Rating Capital Book Mkt. Val. Mkt. Val. Debt/ Debt/ Price! Capital Equity Earnings Company Name Teletech Corporation 16,000 1.15 A-BBB+ 46% 3.0 22% 29% 12.9 Telecommunuications Services Industry Alltel Corp 8,246 AT&T Corp. 30,537 BellSouth Corp 20,350 Centurytel Corp. 2,411 Citizens Communications Co. 2,193 IDT Corp 2,217 SBC Communications Inc. 40,787 Sprint Corp 27,428 Verizon Communications Inc. 71,283 Average 1.00 1.10 1.00 1.05 1.00 A BB+ A BBB+ BB+ NA A A- A+ 42.3% 53.9% 38.1% 42.5% 76.1% 2.5% 32.3% 50.8% 45.0% 42.6% 2.4 2.0 2.1 1.3 3.5 1.2 1.9 2.4 2.6 2.15 23.2% 36.6% 22.9% 37.0% 47.7% 2.1% 20.0% 30.3% 24.1% 27.1% 30.1% 57.7% 29.7% 58.8% 91.1% 2.1% 25.0% 43.4% 31.8% 41.1% 1.05 15.4 (2.4) 16.7 13.3 65.0 (19.3) 19.6 1.05 1.15 1.00 1.04 (43.1) 12.5 8.65 BB NA Telecommunications Equipment Industry Avaya Inc 4,057 Belden CDT Inc. 966 Conmscope Inc. 1,153 Corning Inc. 3,854 Harris Corp. 2,519 Lucent Technologies Inc. 9,045 Nortel Networks Corp 9,828 Plantronics Inc. 560 Scientific-Atlanta Inc 1,708 Average 1.35 1.45 1.10 1.45 1.05 1.75 1.75 1.20 1.45 1.39 BB BBB- BBB- B NA NA NA 14.0% 19.9% 36.9% 41.9% 24.5% 109.8% 43.9% 0.7% 0.4% 32.5% 3.5 1.2 2. 5.4 2.7 (26.0) 4.4% 17.5% 22.4% 11.8% 10.7% 30.1% 20.7% 0.2% 0.1% 13.1% 4.6% 21.3% 28.9% 13.4% 11.9% 43.0% 26.0% 0.2% 0.1% 16.6% 18.3 38.7 10.3 (11.1) 21.9 6.0 (51.8) 17.0 20.7 7.77 3.0 4.2 2.6 (0.15) 3,650 Computer and Network Equipment Industry EMc Corp. 8,229 Gateway Inc. Hewlett-Packard Corp. 79,905 Int'l Business Machines Corp. 96,293 Lexmark Int'l. Inc 5,314 NCR Corp. 5,984 Seagate Technology 6,224 Storage Technology Corp 2,224 Western Digital Corp 3,047 Average 1.55 1.35 1.45 1.10 1.15 1.20 1.20 1.15 1.80 1.33 BBB NA A- A+ NA NA NA NA NA 1.0% 42.3% 12.7% 27.1% 5.5% 13.7% 33.0% 0.8% 12.5% 16.5% 2.9 5.5 1.7 4.1 4.2 3.3 0.4% 11.8% 7.8% 8.4% 1.4% 4.5% 10.0% 0.3% 2.9% 5.3% 0.4% 13.4% 8.5% 9.1% 1.4% 4.8% 11.1% 0.3% 3.0% 5.8% 34.3 (4.2) 18.5 15. 15.5 21.1 25.0 18.2 16.7 17.81 2.4 4.8 3.70 Exhibit 4 TELETECH CORPORATION, 2005 Debt-Capital-Market Conditions, October 2005 Corporate Bond Yields U.S. Treasury Securities Industrials AAA AA A 5.44% 5.51% 5.74% 3-month 6-month 2-year 3-year 5-year 10-year 30-year 3.56% 3.99% 4.23% 4.23% 4.25% 4.39% 4.62% BBB BB B 6.23% 7.47% 8.00% Phones A BBB 6.17% 6.28% Utilities A BBB 5.69% 6.09% Data source: Bloomberg LP. TELETECH CORPORATION, 2005 Margaret Weston, Teletech Corporation's CFO, learned of Victor Yossarian's letter late one evening in early October 2005. Quickly, she organized a team of lawyers and finance staff to assess the threat. Maxwell Harper, the firm's CEO, scheduled a teleconference meeting of the firm's board of directors for the following afternoon. Harper and Weston agreed that before the meeting they needed to fashion a response to Yossarian's assertions about the firm's returns. Raider Dials Teletech "Wake-Up Call Needed," Says Investor New York-The reclusive billionaire Victor Yossarian has acquired a 10 percent stake in Teletech Corporation, a large regional telecommunications firm, and has demanded two seats on the firm's board of directors. The purchase was revealed yesterday in a filing with the Securities and Exchange Commission, and separately in a letter to Teletech's CEO, Maxwell Harper. "The firm is misusing its resources and not earning an adequate return," the letter said. "The company should abandon its misguided entry into computers, and sell its Product and Systems segment. Management must focus on creating value for shareholders." Teletech issued a brief statement emphasizing the virtues of a link between computer technology and telecommunications Wall Street Daily News, October 15, 2005. Ironically, returns had been the subject of debate within the firm's circle of senior managers in recent months. A number of issues had been raised about the hurdle rate used by the company when evaluating performance and setting the firm's annual capital budget. As the company was expected to invest nearly $2 billion in capital projects in the coming year, gaining closure and consensus on those issues had become an important priority for Weston. Now, Yossarian's letter lent urgency to the discussion In the short run, Weston needed to respond to Yossarian. In the long run, she needed to assess the competing viewpoints on Teletech's returns, and she had to recommend new policies as necessary. What should the hurdle rates be for Teletech's two business segments, telecommunications services and its newer products and systems unit? Was the products and systems segment really paying its way? The Company The Teletech Corporation, headquartered in Dallas, Texas, defined itself as a provider of integrated information movement and management." The firm had two main business segments: telecommunications services, which provided long-distance, local, and cellular telephone service to business and residential customers, and the products and systems segment, which engaged in the manufacture of computing and telecommunications equipment. In 2004, telecommunications services had earned a return on capital (ROC)' of 9.10%; products and systems had earned 11%. The firm's current book value of net assets was $16 billion, consisting of $11.4 billion allocated to telecommunications services, and $4.6 billion allocated to products and systems. An internal analysis suggested that telecommunications services accounted for 75% of the market value (MV) of Teletech, while products and systems accounted for 25%. Overall, it appeared that the firm's prospective ROC would be 9.58%. Top management applied a hurdle rate of 9.30% to all capital projects and in the evaluation of the performance of business units. Over the past 12 months, Tele- Teletech Share Prices vs. Market and Industry Indexes tech's shares had not kept pace with the 115 overall stock market or with industry indexes for telephone, equipment, or computer stocks. Securities analysts had remarked on the firm's lackluster earnings growth, pointing especially to increasing competition in telecommuni- cations, as well as disappointing per- formance in the Products and Systems segment. A prominent commentator on TV opined, "There's no precedent for a hostile takeover in this sector, but, in the Nov Dec Jan Feb Mar Apr May June July Aug Sep Oct case of Teletech, there is every reason to try. Telecom EL Computer os SAP 100 Tellum (1/1000) sapu Teleted 95 2014 Telecommunications services The telecommunications services segment provided long-distance, local, and cellular telephone service to more than 7 million customer lines throughout the Southwest and Midwest. Revenues in this segment grew at an average rate of 3% during 2000-04. In 2004, segment revenues, net operating profit after tax (NOPAT), and net assets were $11 billion, $1.18 billion, and $11.4 billion, respectively. Since the court-ordered breakup of the Bell System telephone monopoly in 1983, Teletech had coped with the gradual deregulation of its industry through aggressive expansion Return on capital was calculated as the ratio of net operating profits after tax (NOPAT) to capital. into new services and geographical regions. Most recently, the firm had been a leading bidder for cellular telephone operations and for licenses to offer personal communications services (PCS). In addition, the firm had purchased a number of telephone-operating companies through privatization auctions in Latin America. Finally, the firm had invested aggressively in new technology-primarily, digital switches and optical-fiber cablesin an effort to enhance its service quality. All of those strategic moves had been costly: the capital budget in this segment had varied between $1.5 billion and $2 billion in each of the previous 10 years. Unfortunately, profit margins in the telecommunications segment had been under pressure for several years. Government regulators had been slow to provide rate relief to Teletech for its capital investments. Other leading telecommunications providers had expanded into Teletech's geographical markets and invested in new technology and quality-enhancing assets. Teletech's management noted that large cable-TV companies had aggressively entered the telecommunications market and continued the pressure on profit margins. Nevertheless, Teletech was the dominant service provider in its geographical markets and product segments. Customer surveys revealed that the company was the leader in product quality and customer satisfaction. Its management was confident that the company could command premium prices no matter how the industry might evolve. Products and systems Before 2000, telecommunications had been the company's core business, supplemented by an equipment manufacturing division that produced telecommunications components. In 2000, the company acquired a leading computer-workstation manufacturer with the goal of applying state-of-the-art computing technology to the design of telecommunications equipment. The explosive growth in the microcomputer market and the increased usage of telephone lines to connect home- and office-based computers with mainframes convinced Teletech's management of the potential value of marrying telecommunications equipment with computing technology. Using Teletech's capital base, borrowing ability, and distribution network to catapult growth, the products and systems segment increased its sales by nearly 40% in 2004. This segment's 2004 NOPAT and net assets were $480 million and $4.6 billion, respectively. The products and systems segment was acknowledged as a technology leader in the industry. While this accounted for its rapid growth and pricing power, maintenance of that leadership position required sizable investments in research and development (R&D) and fixed assets. The rate of technological change was increasing, as witnessed by sudden major write-offs by Teletech on products that, until recently, management had thought were still competitive. Major computer manufacturers were entering the telecommunications-equipment industry. Foreign manufacturers were proving to be stiff competition for bidding on major supply contracts. Focus on Value at Teletech We will create value by pursuing business activities that earn premium rates of return. - Teletech Corporation mission statement (excerpt) Translating Teletech's mission statement into practice had been a challenge for Margaret Weston. First, it had been necessary to help managers of the segments and business units understand what creating value meant. Because the segments and smaller business units did not issue securities in the capital markets, the only objective measure of value was the securities prices of the whole corporationbut the activities of any particular manager might not be significant enough to drive Teletech's securities prices. Therefore, the company had adopted a measure of value creation for use at the segment and business-unit level that would provide a proxy for the way investors would view each unit's performance. This measure, called economic profit, multiplied the excess rate of return of the business unit by the capital it used: Economic profit =(ROC- Hurdle rate) x Capital employed Where: NOPAT ROC = Return on capital Capital NOPAT = Net operating profit after taxes Each year, the segment and business-unit executives were evaluated based on economic profit. This measure was an important consideration in strategic decisions about capital allocation, manager promotion, and incentive compensation. The second way in which the value-creation perspective influenced managers was in the assessment of capital-investment proposals. For each investment, projected cash flows were discounted to the present using the firm's hurdle rate to give a measure of the net present value (NPV) of each project. A positive (or negative) NPV indicated the amount by which the value of the firm would increase or decrease) if the project were undertaken. The following shows how the hurdle rate was used in the familiar NPV equation: n Net present value Free cash flow, (1 + Hurdle rate) - Initial investment 1 = 1 Hurdle Rates The hurdle rate used in the assessments of economic profit and NPV had been the focus of considerable debate in recent months. This rate was based on an estimate of Teletech's weighted average cost of capital (WACC). Management was completely satisfied with the intellectual relevance of a hurdle rate as an expression of the opportunity cost of money. The notion that the WACC represented this opportunity cost had been hotly debated within the company, and while its measurement had never been considered wholly scientific, it was generally accepted. Teletech was split-rated between A- and BBB+. An investment banker recently suggested that at those ratings, new debt funds might cost Teletech 5.88% (about 3.53% after a 40% tax rate). With a beta of 1.15, the cost of equity might be about 10.95%. At market value weights of 22% for debt and 78% for equity, the resulting WACC would be 9.30%. Exhibit 1 summarizes the calculation. The hurdle rate of 9.30% was applied to all investment and performance-measurement analyses at the firm. Arguments for risk-adjusted hurdle rates How the rate should be used within the company in evaluating projects was another point of debate. Given the differing natures of the two businesses and the risks each one faced, differences of opinion arose at the segment level over the appropriateness of measuring all projects against the corporate hurdle rate of 9.30%. The chief advocate for multiple rates was Rick Phillips, executive vice president of telecommunications services, who presented his views as follows: Each phase of our business is different. They must compete differently and must draw on capital differently. Given the historically stable nature of this industry, many telecommunications companies can raise large quantities of capital from the debt markets. In operations comparable to telecommunications services, 50% of the necessary capital is raised in the debt markets at interest rates reflecting solid A quality, on average. This is better than Teletech's corporate bond rating of A-/BBB+. I also have to believe that the cost of equity for telecommunications services is lower than it is for products and systems. Although the products and systems segment's sales growth and profitability have been strong, its risks are high. Independent equipment manufacturers are financed with higher-yielding BB-rated debt and a greater proportion of equity. In my book, the hurdle rate for products and systems should reflect those higher costs of funds. Without the risk-adjusted system of hurdle rates, telecommunications services will gradually starve for capital, while products and systems will be force-fed-that's because our returns are less than the corporate hurdle rate, and theirs are greater. Telecommunications services lowers the risk of the whole corporation, and should not be penalized. Here's a rough graph of what I think is going on (Figure 2): Figure 2. Rick Phillips's assessment of constant versus risk-adjusted hurdle rates. 18.00% 16.00% 14.00% Products and Systems 12.00% 10.00% % Rate of Return Risk-adjusted Hurdle - Teletech Corp. Hurdle A Telecomm. Services O Products and Systems 8.00% 6.00% 4.00% Telecommunications Services 2.00% 0.00% Risk Free Low Risk Teletech Corp. Higher Risk Risk Level Telecommunications services, which can earn 9.10% on capital, is actually profitable on a risk-adjusted basis, even though it is not profitable compared to the corporate hurdle rate. The triangle shape on the drawing shows about where telecommunications services is located. My hunch is that the reverse is true for products and systems [P&S], which promises to earn 11.0% on capital. P&S is located on the graph near the little circle. In deciding how much to loan us, lenders will consider the composition of risks. If money flows into safer investments, over time the cost of their loans to us will decrease. Our stockholders are equally as concerned with risk. If they perceive our business as being more risky than other companies are, they will not pay as high a price for our earnings. Perhaps this is why our price-to-earnings ratio is below the industry average most of the time. It is not a question of whether we adjust for risk-we already do, informally. The only question in my mind is whether we make those adjustments systematically or not. While multiple hurdle rates may not reflect capital-structure changes on a day-to- day basis, over time they will reflect prospects more realistically. At the moment, as I understand it, our real problem is an inadequate and very costly supply of equity funds. If we are really rationing equity capital, then we should be striving for the best returns on equity for the risk. Multiple hurdle rates achieve that objective. Implicit in Phillips's argument, as Weston understood it, was the notion that if each segment in the company had a different hurdle rate, the costs of the various forms of capital would remain the same. The mix of capital used, however, would change in the calculation. Low-risk operations would use leverage more extensively, while the high-risk divisions would have little to no debt funds. This lower-risk segment would have a lower hurdle rate. Opposition to risk-adjusted hurdle rates While several others within Teletech supported Phillips's views, opposition was strong within the products and systems segment. Helen Buono, executive vice president of products and systems, expressed her opinion as follows: All money is green. Investors can't know as much about our operations as we do. To them the firm is a black box, they hire us to take care of what is inside the box, and judge us by the dividends coming out of the box. We can't say that one part of the box has a different hurdle rate than another part of the box if our investors don't think that way. Like I say, all money is green: all investments at Teletech should be judged against one hurdle rate. Multiple hurdle rates are illogical Suppose that the hurdle rate for telecommunications services was much lower than the corporate-wide hurdle rate. If we undertook investments that met the segment hurdle rate, we would be destroying shareholder value because we weren't meeting the corporate hurdle rate. Our job as managers should be to put our money where the returns are best. A single hurdle rate may deprive an under profitable division of investments in order to channel more funds into a more profitable division, but isn't that the aim of the process? Our challenge today is simple: we must earn the highest absolute rates of return that we can get. In reality, we don't finance each division separately. The corporation raises capital based on its overall prospects and record. The diversification of the company probably helps keep our capital costs down and enables us to borrow more in total than the sum of the capabilities of the divisions separately. As a result, developing separate hurdle rates is both unrealistic and misleading. All our stockholders want is for us to invest our funds wisely in order to increase the value of their stock. This happens when we pick the most promising projects, irrespective of the source. Margaret Weston's Concerns As Weston listened to these arguments, presented over the course of several months, she became increasingly concerned about several related considerations. First, Teletech's corporate strategy had directed the company toward integrating the two segments. One effect of using multiple hurdle rates would be to make justifying high-technology research and application proposals more difficult, as the required rate of return would be increased. On the one hand, she thought, perhaps multiple hurdle rates were the right idea, but the notion that they should be based on capital costs rather than strategic considerations might be wrong. On the other hand, perhaps multiple rates based on capital costs should be used, but, in allocating funds, some qualitative adjustment should be made for unquantifiable strategic considerations. In Weston's mind, the theory was certainly not clear on how to achieve strategic objectives when allocating capital. Second, using a single measure of the cost of money (the hurdle rate or discount factor) made the NPV results consistent, at least in economic terms. If Teletech adopted multiple rates for discounting cash flows, Weston was afraid that the NPV and economic-profit calculations would lose their meaning and comparability across business segments. To her, a performance criterion had to be consistent and understandable, or it would not be useful. In addition, Weston was concerned about the problem of attributing capital structures to divisions. In the telecommunications services segment, a major new switching station might be financed by mortgage bonds. In products and systems, however, it was impossible for the division to borrow directly; indeed, any financing was only feasible because the corporation guaranteed the debt. Such projects were considered highly riskyat best, perhaps, warranting only a minimal debt structure. Also, Weston considered the debt-capacity decision difficult enough for the corporation as a whole, let alone for each division. Judgments could only be very crude. In further discussions with others in the organization about the use of multiple hurdle rates, Weston discovered two predominant themes. One argument held that investment decisions should never be mixed with financing decisions. A firm should first decide what its investments should be and then determine how to finance them most efficiently. Adding leverage to a present-value calculation would distort the results. The use of multiple hurdle rates was simply a way of mixing financing with investment analysis. This argument also held that a single rate made the risk decision clear-cut. Management could simply adjust its standard (NPV or economic profit) as the risks increased. The contrasting line of reasoning noted that the WACC tended to represent an average market reaction to a mixture of risks. Lower-than-average-risk projects should probably be accepted even when they did not meet the weighted-average criterion. Higher-than-normal-risk projects should provide a return premium. While the multiple-hurdle-rate system was a crude way to achieve this end, at least it was a step in the right direction. Moreover, some argued that Teletech's objective should be to maximize return on equity funds, and because equity funds were and would remain a comparatively scarce resource, a multiple-rate system would tend to maximize returns to stockholders better than a single-rate system would. To help resolve these issues, Weston asked her assistant, Bernard Ingles, to summarize the scholarly thought regarding multiple hurdle rates. His memorandum is given in Exhibit 2. She also requested that Ingles obtain samples of firms comparable with the telecommunications services segment and the products and systems unit that might be used in deriving segment WACCs. A summary of the data is given in Exhibit 3. Information on capital-market conditions in October 2005 is given in Exhibit 4. Conclusion Weston could not realistically hope that all the issues before her would be resolved in time to influence Victor Yossarian's attack on management. But the attack did dictate the need for an objective assessment of the performance of Teletech's two segmentsthe choice of hurdle rates would be very important in the analysis. She did want to institute a pragmatic system of appropriate hurdle rates (or one rate), however, that would facilitate judgments in the changing circumstances faced by Teletech. What were the appropriate hurdle rates for the two segments? Was the products and systems segment underperforming, as suggested by Yossarian? How should Teletech respond to the raider? Exhibit 1 TELETECH CORPORATION, 2005 Summary of the WACC Calculation for Teletech Corporation and Segment Worksheet MV asset weights Bond rating Pretax cost of debt Tax rate After-tax cost of debt Corporate 100% A-/BBB+ 5.88% 40% 3.53% Telecommunications Services 75% A 5.74% 40% 3.44% Products and Systems 25.00% BB 7.47% 40% 4.48% Equity beta R RM 1.15 4.62% 10.12% 5.50% 10.95% RM-R Cost of equity Weight of debt Weight of equity WACC 22.2% 77.8% 9.30% Data source: Bloomberg LP, S&P Research Insight, and case writer analysis. Exhibit 2 TELETECH CORPORATION, 2005 Theoretical Overview of Multiple Hurdle Rates To: From: Subject: Date: Margaret Weston Bernard Ingles Segment cost-of-capital theory October 2005 You requested an overview of the theories on multiple hurdle rates. Without getting into the minutiae, the theories boil down to the following points: 1. The central idea is that required returns should be driven by risk. This is the dominant view in the field of investment management, and is based on a mountain of theory and empirical research stretching over several decades. The extension of this idea from investment management to corporate decision making is, at least in theory, straightforward. 2. An underlying assumption is that the firm is transparent (i.e., that investors can see through the corporate veil and evaluate the activities going on inside). No one believes firms are completely transparent, or that investors are perfectly informed. But financial accounting standards have evolved toward making the firm more transparent. And the investment community has grown tougher and sharper in its analysis. Teletech now has 36 analysts publishing both reports and forecasts on the firm. The reality is that for big publicly held firms, transparency is not a bad assumption. 3. Another underlying assumption is that the value of the whole enterprise is simply the sum of its partsthis is the concept of value additivity. We can define parts as either the business segments on the left-hand side of the balance sheet) or the layers of the capital structure on the right-hand side of the balance sheet). Market values have to balance. MV Teletech = ( MV Telecommunication Services + MV Products +-Systems ) = ( MV debe + MV equity) If those equalities did not hold, then a raider could come along and exploit the inequality by buying or selling the whole and the parts. This is arbitrage. By buying and selling, the actions of the raider would drive the MVs back into balance. Exhibit 2 (continued) 4. Investment theory tells us that the only risk that matters is nondiversifiable risk, which is measured by beta. Beta indicates the risk that an asset will add to a portfolio. Since we assume that an investor is diversified, we also assume she seeks a return for only the risk that she cannot shed, which is the nondiversifiable risk. The important point here is that the beta of a portfolio is equal to a weighted average of the betas of the portfolio components. Extending this to the corporate environment, the asset beta for the firm will equal a weighted average of the components of the firm-again, the components of the firm can be defined in terms of either the right-hand side or the left-hand side of the balance sheet Preletech Assets = (W Tel.Serv. Prel. Serv. + Wp+s Bp+s) = (Welebe Belebe + Wequiry equity) Where: w = percentage weights based on market values. Brel ServBpts = Asset betas for business segments. Bdebe = B for the firm's debt securities. Bequiry = Bof firm's common stock (given by Bloomberg, etc.) This is a very handy way to model the risk of the firm, for it means that we can use the capital asset pricing model to estimate the cost of capital for a segment (i.e., using segment asset betas). 5. Given the foregoing, it follows that the weighted average of the various costs of capital (K) for the firm (WACC), which is the theoretically correct hurdle rate, is simply a weighted average of segment WACCs: WACC Teletech = (Wrel, Ser: WACC Tel Serv) + (WP+SWACCP+s) Where: percentage weights based on market values. W WACC rel. Serv. = W debt, Tel. Serv. K debe, Tel. Serv) + (Wequity. Tel. Serv. K equity, Vel. Serv) WACCP+S = (W debt, P+S K deb, P+S) + (Wequity, P+S K equity, P+) Exhibit 2 (continued) 6. The notion in point number 5 may not hold exactly in practice. First, most of the components in the WACC formula are estimated with some error. Second, because of taxes, information asymmetries, or other market imperfections, assets may not be priced strictly in line with the modelfor a company like Teletech, it is reasonable to assume that any mispricings are just temporary. Third, the simple two-segment characterization ignores a hidden third segment: the corporate treasury department that hedges and aims to finance the whole corporation optimally-this acts as a shock absorber for the financial policies of the segments. Modeling the WACC of the corporate treasury department is quite difficult. Most companies assume that the impact of corporate treasury is not very large, and simply assume it away. As a first cut, we could do this too, although it is an issue we should revisit Conclusions In theory, the corporate WACC for Teletech is appropriate only for evaluating an asset having the same risk as the whole company. It is not appropriate for assets having different risks than the whole company. Segment WACCs are computed similarly to corporate WACCs. In concept, the corporate WACC is a weighted average of the segment WACCs. In practice, the weighted average concept may not hold, due to imperfections in the market and/or estimation errors. If we start computing segment WACCs, we must use the cost of debt, cost of equity, and the weights appropriate to that segment. We need a lot of information to do this correctly, or else we really need to stretch to make assumptions. Exhibit 3 TELETECH CORPORATION, 2005 Samples of Comparable Firms Book Val. 2004 Equity Bond Debt/Total Price to Revenues Beta Rating Capital Book Mkt. Val. Mkt. Val. Debt/ Debt/ Price! Capital Equity Earnings Company Name Teletech Corporation 16,000 1.15 A-BBB+ 46% 3.0 22% 29% 12.9 Telecommunuications Services Industry Alltel Corp 8,246 AT&T Corp. 30,537 BellSouth Corp 20,350 Centurytel Corp. 2,411 Citizens Communications Co. 2,193 IDT Corp 2,217 SBC Communications Inc. 40,787 Sprint Corp 27,428 Verizon Communications Inc. 71,283 Average 1.00 1.10 1.00 1.05 1.00 A BB+ A BBB+ BB+ NA A A- A+ 42.3% 53.9% 38.1% 42.5% 76.1% 2.5% 32.3% 50.8% 45.0% 42.6% 2.4 2.0 2.1 1.3 3.5 1.2 1.9 2.4 2.6 2.15 23.2% 36.6% 22.9% 37.0% 47.7% 2.1% 20.0% 30.3% 24.1% 27.1% 30.1% 57.7% 29.7% 58.8% 91.1% 2.1% 25.0% 43.4% 31.8% 41.1% 1.05 15.4 (2.4) 16.7 13.3 65.0 (19.3) 19.6 1.05 1.15 1.00 1.04 (43.1) 12.5 8.65 BB NA Telecommunications Equipment Industry Avaya Inc 4,057 Belden CDT Inc. 966 Conmscope Inc. 1,153 Corning Inc. 3,854 Harris Corp. 2,519 Lucent Technologies Inc. 9,045 Nortel Networks Corp 9,828 Plantronics Inc. 560 Scientific-Atlanta Inc 1,708 Average 1.35 1.45 1.10 1.45 1.05 1.75 1.75 1.20 1.45 1.39 BB BBB- BBB- B NA NA NA 14.0% 19.9% 36.9% 41.9% 24.5% 109.8% 43.9% 0.7% 0.4% 32.5% 3.5 1.2 2. 5.4 2.7 (26.0) 4.4% 17.5% 22.4% 11.8% 10.7% 30.1% 20.7% 0.2% 0.1% 13.1% 4.6% 21.3% 28.9% 13.4% 11.9% 43.0% 26.0% 0.2% 0.1% 16.6% 18.3 38.7 10.3 (11.1) 21.9 6.0 (51.8) 17.0 20.7 7.77 3.0 4.2 2.6 (0.15) 3,650 Computer and Network Equipment Industry EMc Corp. 8,229 Gateway Inc. Hewlett-Packard Corp. 79,905 Int'l Business Machines Corp. 96,293 Lexmark Int'l. Inc 5,314 NCR Corp. 5,984 Seagate Technology 6,224 Storage Technology Corp 2,224 Western Digital Corp 3,047 Average 1.55 1.35 1.45 1.10 1.15 1.20 1.20 1.15 1.80 1.33 BBB NA A- A+ NA NA NA NA NA 1.0% 42.3% 12.7% 27.1% 5.5% 13.7% 33.0% 0.8% 12.5% 16.5% 2.9 5.5 1.7 4.1 4.2 3.3 0.4% 11.8% 7.8% 8.4% 1.4% 4.5% 10.0% 0.3% 2.9% 5.3% 0.4% 13.4% 8.5% 9.1% 1.4% 4.8% 11.1% 0.3% 3.0% 5.8% 34.3 (4.2) 18.5 15. 15.5 21.1 25.0 18.2 16.7 17.81 2.4 4.8 3.70 Exhibit 4 TELETECH CORPORATION, 2005 Debt-Capital-Market Conditions, October 2005 Corporate Bond Yields U.S. Treasury Securities Industrials AAA AA A 5.44% 5.51% 5.74% 3-month 6-month 2-year 3-year 5-year 10-year 30-year 3.56% 3.99% 4.23% 4.23% 4.25% 4.39% 4.62% BBB BB B 6.23% 7.47% 8.00% Phones A BBB 6.17% 6.28% Utilities A BBB 5.69% 6.09% Data source: Bloomberg LP