

Question
Terence Breezeway, the CEO of Prairie Home Stores, wondered what retirement would be like. It was almost 20 years to the day since his uncle
Terence Breezeway, the CEO of Prairie Home Stores, wondered what retirement would be like. It was almost 20 years to the day since his uncle Jacob Breezeway, Prairie Homes founder, had asked him to take responsibility for managing the company. Now it was time to spend more time riding and fishing on the old Lazy Beta Ranch.
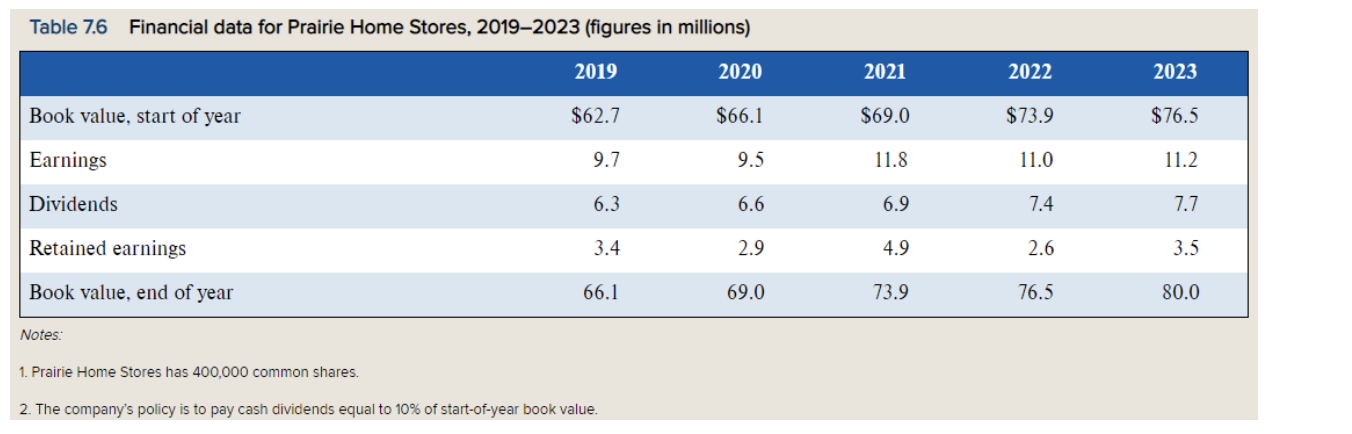
Under Mr. Breezeways leadership Prairie Home had grown slowly but steadily and was solidly profitable. ( Table 7.6 shows earnings, dividends, and book asset values for the last 5 years.) Most of the companys supermarkets had been modernized and its brand name was well known.
Mr. Breezeway was proud of this record, although he wished that Prairie Home could have grown more rapidly. He had passed up several opportunities to build new stores in adjacent counties. Prairie Home was still just a family company. Its common stock was distributed among 15 grandchildren and nephews of Jacob Breezeway, most of whom had come to depend on generous regular dividends. The commitment to high dividend payout had reduced the earnings available for reinvestment and thereby constrained growth. (The company traditionally paid out cash dividends equal to 10% of start-of-period book valuesee Table 7.6.)
Mr. Breezeway believed the time had come to take Prairie Home public. Once its shares were traded in the public market, the Breezeway descendants who needed (or just wanted) more cash to spend could sell off part of their holdings. Others with more interest in the business could hold on to their shares and be rewarded by higher future earnings and stock prices. But if Prairie Home did go public, what should its shares sell for? Mr. Breezeway worried that shares would be sold, either by Breezeway family members or by the company itself, at too low a price. One relative was about to accept a private offer for $200, the current book value per share, but Mr. Breezeway had intervened and convinced the would-be seller to wait.
Prairie Homes value depended not just on its current book value or earnings but on its future prospects, which were good. One financial projection (shown in the top panel of Table 7.7 ) called for growth in earnings of over 100% by 2030. Unfortunately, this plan would require reinvestment of all of Prairie Homes earnings from 2024 to 2027. After that the company could resume its normal dividend payout and growth rate. Mr. Breezeway believed this plan was feasible.
He was determined to step aside for the next generation of top management. But before retiring, he had to decide whether to recommend that Prairie Home Stores go publicand before that decision he had to know what the company was worth. The next morning he rode thoughtfully to work. He left his horse at the south corral and ambled down the dusty street to Mike Gordons Saloon, where Francine Firewater, the companys CFO, was having her usual steak-and-beans breakfast. He asked Ms. Firewater to prepare a formal report to Prairie Home stockholders, valuing the company on the assumption that its shares were publicly traded.
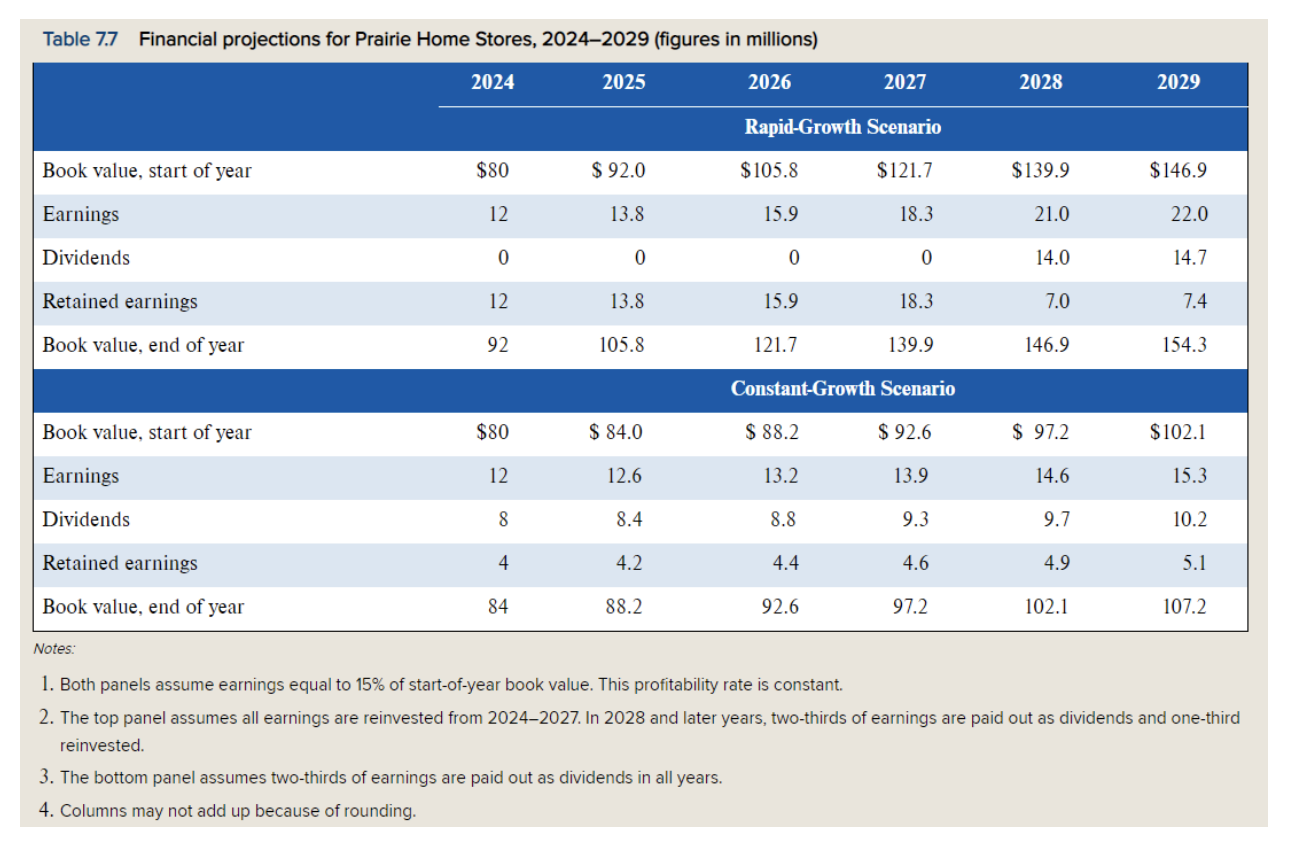 Ms. Firewater asked two questions immediately. First, what should she assume about investment and growth? Mr. Breezeway suggested two valuations, one assuming more rapid expansion (as in the top panel of Table 7.7 ) and another just projecting past growth (as in the bottom panel of Table 7.7 ).
Second, what rate of return should she use? Mr. Breezeway said that 15%, Prairie Homes usual return on book equity, sounded right to him, but he referred her to an article in the Journal of Finance indicating that investors in rural supermarket chains, with risks similar to Prairie Home Stores, expected to earn about 11% on average.
ASSIGNMENT: This case is taking place in the beginning of 2024. Do valuation of the company as of that time, using the dividend discount model, separately based on each of the two scenarios in Table 7.7. Starting after 2029, you can assume constant perpetual growth of dividends of 3% per year for both scenarios.
a) Which discount rate is correct? (15% or 11%)?
b) How does your answer regarding the value per share differ depending on the rapid-growth vs. constant-growth scenario? Which scenario should the company choose to maximize the current share price (which is the present value of all future dividends)?
c) How does the valuation depend on the discount rate? For the rapid-growth scenario, graph the relationship between value per share (y-axis) and the discount rate (x-axis) in the range between 9% and 16%, holding the growth rate constant at 3%.
d) How does the valuation depend on the long-run growth rate after 2029? For the rapid-growth scenario, graph the relationship between value per share (y-axis) and the growth rate (x-axis) in a range between 0% and 6%, holding the discount rate constant at the rate you chose from part
Table 7.6 Financial data for Prairie Home Stores, 2019-2023 (figures in millions) 2019 2020 2021 2022 2023 Book value, start of year $62.7 $66.1 $69.0 $73.9 $76.5 Earnings 9.7 9.5 11.8 11.0 11.2. Dividends 6.3 6.6 6.9 7.4 7.7 Retained earnings 3.4 2.9 4.9 2.6 3.5 Book value, end of year 66.1 69.0 73.9 76.5 80.0 Notes: 1. Prairie Home Stores has 400,000 common shares. 2. The company's policy is to pay cash dividends equal to 10% of start-of-year book value. Table 7.7 Financial projections for Prairie Home Stores, 20242029 (figures in millions) 2024 2025 2026 2027 2028 2029 Rapid-Growth Scenario Book value, start of year $80 $ 92.0 $105.8 $121.7 $139.9 $146.9 Earnings 12 13.8 15.9 18.3 21.0 22.0 Dividends 0 0 0 0 14.0 14.7 Retained earnings 12 13.8 15.9 18.3 7.0 7.4 Book value, end of year 92 105.8 121.7 139.9 146.9 154.3 Constant-Growth Scenario Book value, start of year $80 $ 84.0 $ 88.2 $ 92.6 $ 97.2 $102.1 Earnings 12 12.6 13.2 13.9 14.6 15.3 Dividends 8 8.4 8.8 9.3 9.7 10.2 Retained earnings 4 4.2 4.4 4.6 4.9 5.1 Book value, end of year 84 88.2 92.6 97.2 102.1 107.2 Notes: 1. Both panels assume earnings equal to 15% of start-of-year book value. This profitability rate is constant. 2. The top panel assumes all earnings are reinvested from 20242027. In 2028 and later years, two-thirds of earnings are paid out as dividends and one-third reinvested. 3. The bottom panel assumes two-thirds of earnings are paid out as dividends in all years. 4. Columns may not add up because of rounding. Table 7.6 Financial data for Prairie Home Stores, 2019-2023 (figures in millions) 2019 2020 2021 2022 2023 Book value, start of year $62.7 $66.1 $69.0 $73.9 $76.5 Earnings 9.7 9.5 11.8 11.0 11.2. Dividends 6.3 6.6 6.9 7.4 7.7 Retained earnings 3.4 2.9 4.9 2.6 3.5 Book value, end of year 66.1 69.0 73.9 76.5 80.0 Notes: 1. Prairie Home Stores has 400,000 common shares. 2. The company's policy is to pay cash dividends equal to 10% of start-of-year book value. Table 7.7 Financial projections for Prairie Home Stores, 20242029 (figures in millions) 2024 2025 2026 2027 2028 2029 Rapid-Growth Scenario Book value, start of year $80 $ 92.0 $105.8 $121.7 $139.9 $146.9 Earnings 12 13.8 15.9 18.3 21.0 22.0 Dividends 0 0 0 0 14.0 14.7 Retained earnings 12 13.8 15.9 18.3 7.0 7.4 Book value, end of year 92 105.8 121.7 139.9 146.9 154.3 Constant-Growth Scenario Book value, start of year $80 $ 84.0 $ 88.2 $ 92.6 $ 97.2 $102.1 Earnings 12 12.6 13.2 13.9 14.6 15.3 Dividends 8 8.4 8.8 9.3 9.7 10.2 Retained earnings 4 4.2 4.4 4.6 4.9 5.1 Book value, end of year 84 88.2 92.6 97.2 102.1 107.2 Notes: 1. Both panels assume earnings equal to 15% of start-of-year book value. This profitability rate is constant. 2. The top panel assumes all earnings are reinvested from 20242027. In 2028 and later years, two-thirds of earnings are paid out as dividends and one-third reinvested. 3. The bottom panel assumes two-thirds of earnings are paid out as dividends in all years. 4. Columns may not add up because of roundingStep by Step Solution
There are 3 Steps involved in it
Step: 1

Get Instant Access to Expert-Tailored Solutions
See step-by-step solutions with expert insights and AI powered tools for academic success
Step: 2

Step: 3
Ace Your Homework with AI
Get the answers you need in no time with our AI-driven, step-by-step assistance
Get Started
Applied Equity Analysis and Portfolio Management Tools to Analyze and Manage Your Stock Portfolio
Authors: Robert A.Weigand
1st edition
978-111863091, 1118630912, 978-1118630914