Answered step by step
Verified Expert Solution
Question
1 Approved Answer
TE's Long Life LED light bulbs are designed to have a life of 1120 hours and packed in 25-unit packs. The manufacturer tends to set
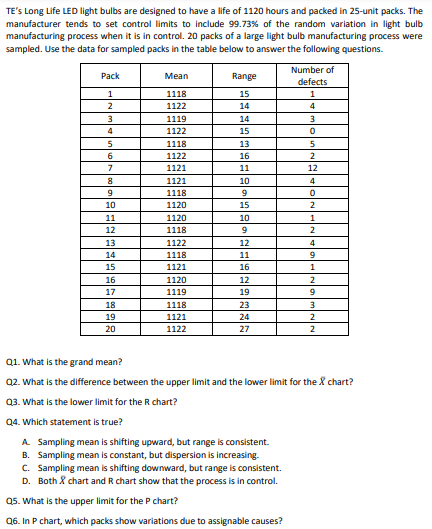
TE's Long Life LED light bulbs are designed to have a life of 1120 hours and packed in 25-unit packs. The manufacturer tends to set control limits to include 99.73% of the random variation in light bulb manufacturing process when it is in control. 20 packs of a large light bulb manufacturing process were sampled. Use the data for sampled packs in the table below to answer the following questions. Q1. What is the grand mean? Q2. What is the difference between the upper limit and the lower limit for the X chart? Q3. What is the lower limit for the R chart? Q4. Which statement is true? A. Sampling mean is shifting upward, but range is consistent. B. Sampling mean is constant, but dispersion is increasing- C. Sampling mean is shifting downward, but range is consistent. D. Both X chart and R chart show that the process is in control. Q5. What is the upper limit for the P chart? Q6. In P chart, which packs show variations due to assignable causes
Step by Step Solution
There are 3 Steps involved in it
Step: 1
Get Instant Access to Expert-Tailored Solutions
See step-by-step solutions with expert insights and AI powered tools for academic success
Step: 2
Step: 3
Ace Your Homework with AI
Get the answers you need in no time with our AI-driven, step-by-step assistance
Get Started