

Answered step by step
Verified Expert Solution
Question
1 Approved Answer
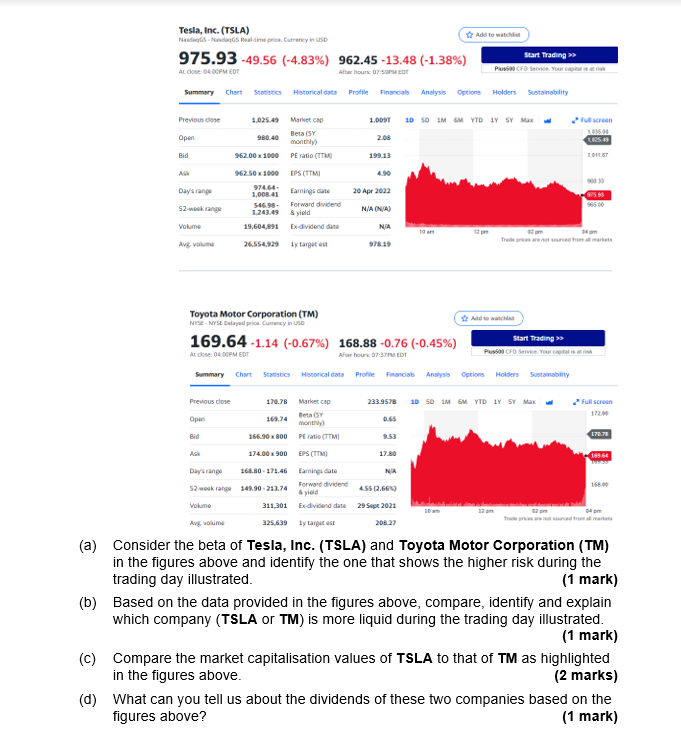
Tesla, Inc. (TSLA) Na-Nasa Real-time price. Currency in USD Start Trading >> 975.93-49.56 (-4.83 % ) 962.45-13.48 (-1.38%) Plus500 CFD Service. Your capital is at
Step by Step Solution
There are 3 Steps involved in it
Step: 1

Get Instant Access to Expert-Tailored Solutions
See step-by-step solutions with expert insights and AI powered tools for academic success
Step: 2

Step: 3
Ace Your Homework with AI
Get the answers you need in no time with our AI-driven, step-by-step assistance
Get Started
How To Get Money For College Financing Your Future Beyond Federal Aid
Authors: Mark D. Snider
1st Edition
0768928869, 978-0768928860