

Question: test() 1 Overview Lab 6 will cover tuples and random number generation, both of which are used in this program. I suggest you view this
test()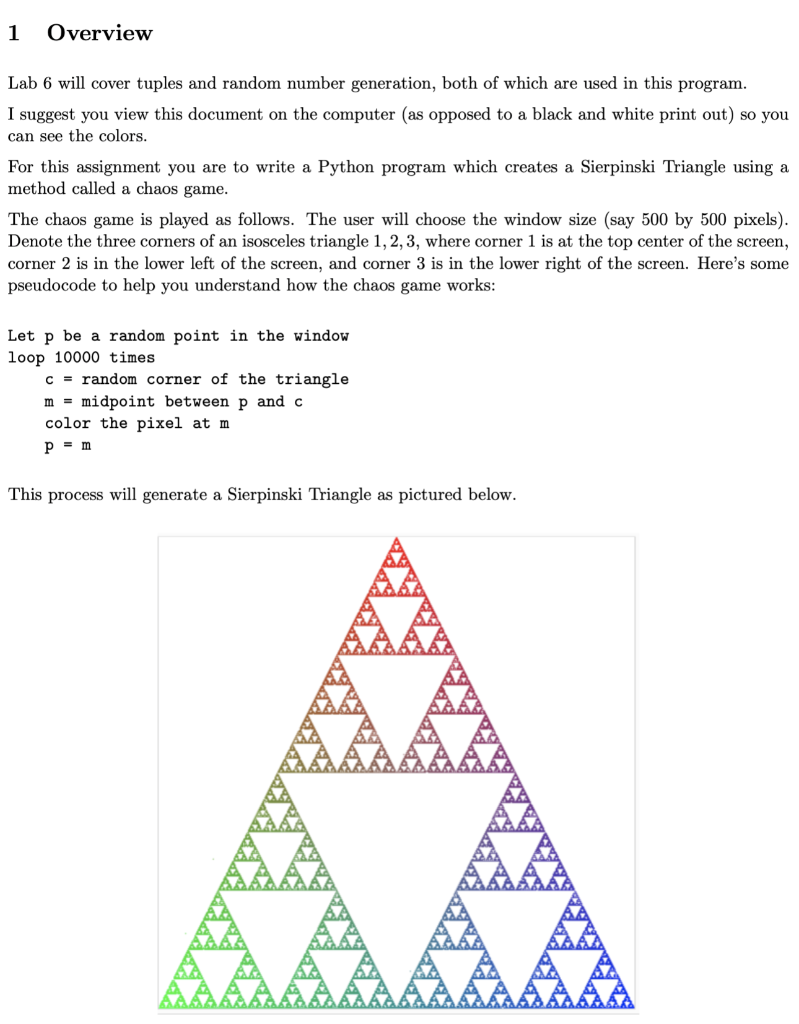
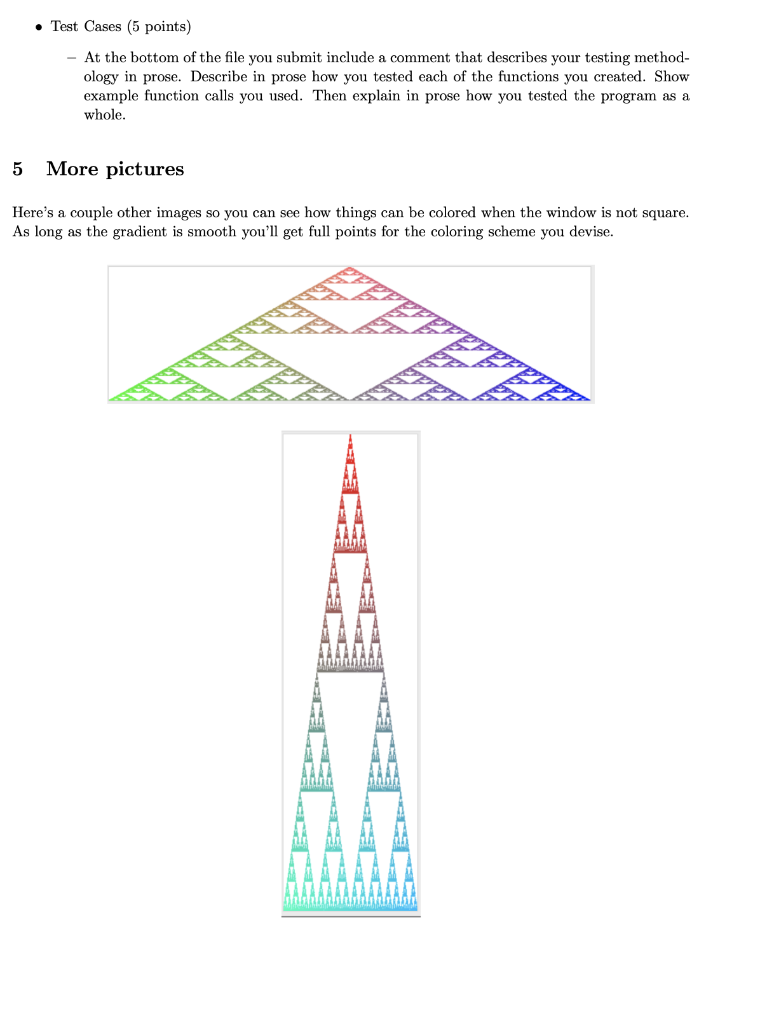
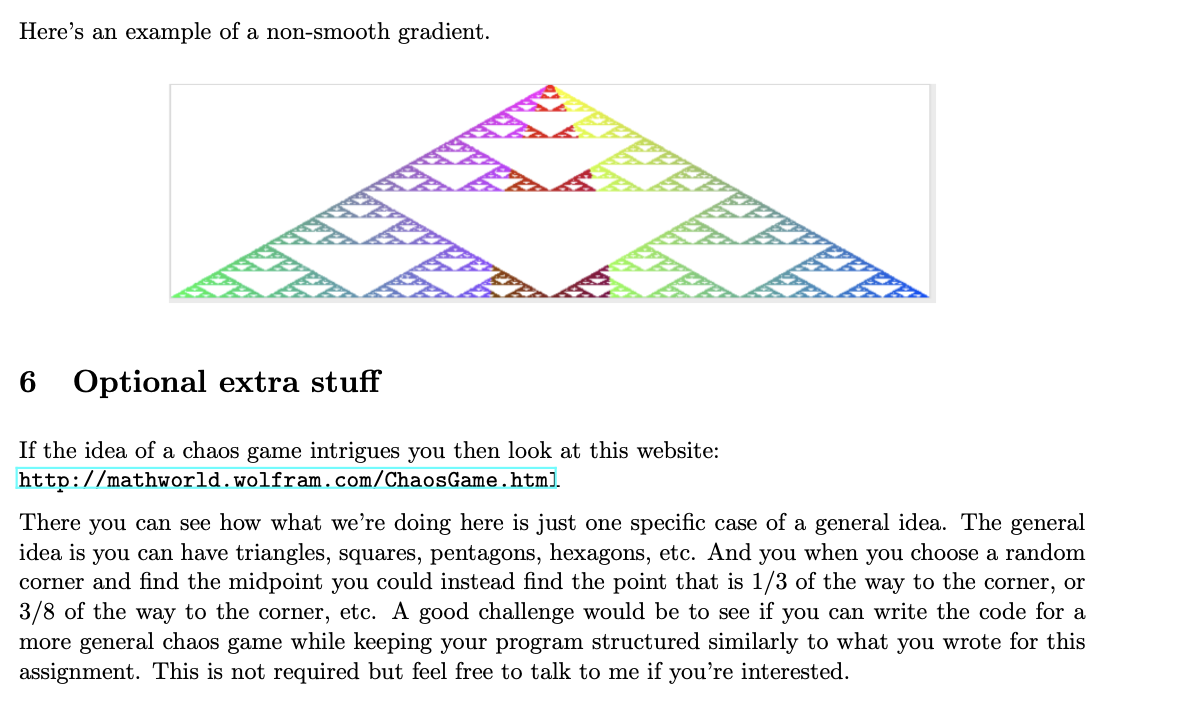
1 Overview Lab 6 will cover tuples and random number generation, both of which are used in this program. I suggest you view this document on the computer (as opposed to a black and white print out) so you can see the colors. For this assignment you are to write a Python program which creates a Sierpinski Triangle using a method called a chaos game. The chaos game is played as follows. The user will choose the window size (say 500 by 500 pixels). Denote the three corners of an isosceles triangle 1, 2, 3, where corner 1 is at the top center of the screen, corner 2 is in the lower left of the screen, and corner 3 is in the lower right of the screen. Here's some pseudocode to help you understand how the chaos game works: Let p be a random point in the window loop 10000 times c = random corner of the triangle m = midpoint between p and c color the pixel at m P = m This process will generate a Sierpinski Triangle as pictured below. 2 Details 1. One thing you might notice if you try this on paper (or if you carefully look at the image you generate once it's complete) is that the first few iterations of this game may produce points that are not actually part of the Sierpinski triangle. Thus, you should start the process of generating points, but don't plot the first few points you calculate. To be safe you should start adding points to the image after 10 iterations. 2. I've given you two files, hw3_handout.py and graphics.py, which are both available on Canvas. I'd like to give credit to John Zelle who wrote the graphics.py package. John Zelle did a good job of simplifying some tricky things in Python to make it easy to open a window and to plot points of a particular color in that window. This file should be in the same directory as the program you're writing. The hw3_handout.py file will get you started with a few lines of code that show you the basic graphics functions you will use for this project. These lines of code just take some input from the user and open a window of the desired size. Then I show how to plot four adjacent points in the window (I showed four adjacent pixels because sometimes it's hard to see just one). 3. The RGB color scheme is a commonly used system of representing a color. Part of the graphics.py package is a function called color_rgb() which takes three parameters. Each of the parameters is an integer value from 0 to 255 that represents a color. For instance (255, 0, 0) is red, 0,255,0) is green and (0, 0, 255) is blue. Furthermore, (255, 255, 255) is white and (0,0,0) is black. Also, I want to point out how the window is structured. The upper left corner of the window is position (0,0) and the bottom right is position (width, height), the top right is position (width,0) and the bottom left is position (0,height). Thus, the first coordinate is the x coordinate and the second coordinate is the y coordinate, but, unlike the first quadrant of the Cartesian coordinate system, the y axis increases as you move down the window. Thus, to set a particular pixel to a color you say: win.plot(x, y, color_rgb(red, green, blue)) where x and y are the coordinates of the point and red, green, blue are integer values between 0 and 255 for the amount of red, green and blue of the color of the point you want to plot. In the handout I show you how to plot four red points near the center of the window you defined. 4. If you simply followed the pseudocode at the top of this document and set each pixel to black then you'd have a black and white version of the Sierpinski triangle. That's a good first step to make sure your chaos procedure is working correctly. However, I want you to color the triangle to make it prettier! I'm letting you get creative with this step but the basic idea I want you to follow is that each corner is a "base" color (e.g. red, green or blue). Set up three variables called corneri, corner2, corner3 as follows: corner1 = (width//2, 0) corner2 = (0,height) corner3 = (width, height) # the red corner (top middle of window) # the green corner (lower left of window) # the blue corner (lower right of window) Notice that each of these variables is a 2-tuple (because I used parentheses). Also notice that I am referring to a base color for each corner in the comments. Stick to these base color assignments to make the TAs' job easier. The color of other points that you plot should be blended according to how far they are from each corner and there should be a nice gradient across the triangle. This is not too difficult in a square window but you need to be a little more careful in a non-square window (when the width of the window is not equal to the height of the window). 3 Hints 1. In lab you wrote a midpoint function. Use it as is or modify it slightly for this program. 2. Drawing a black and white triangle is a great first step. Once that is working then all you have to do is come up with a coloring scheme and instead of assigning black to each new pixel when you calculate its location you can call a function to generate a color based on the point's distance from each corner and assign that color to the new pixel. You also wrote a distance function in lab, you can make use of that here to compute the distance to each corner. 3. I used three 2-tuples to represent the three corner points of the triangle (notice how I did that by including the x and y coordinates inside parentheses. The parentheses tell Python that this is a tuple. Please observe this convention. We could just create six variables x1, yl, x2, 42, 23, y3 but I think it's cleaner to pass the points to functions as 2-tuples so we're passing only three variables. 4. Turn in code that draws 50000 points. Note that each time you plot a new point the computer redraws the image in its entirety which gets "harder" to do as there are more points to draw. Thus, the first 10000 iterations will actually happen faster than the last 10000. You are welcome to test this with 100000 points or 200000 points but that will take significantly longer than 50000 points but the resolution of the image will be better with more points generally speaking. 4 Grading Rubric Style and Clarity (20 points) You should add at least two functions to this program and no more than four (FYI my program had three additional functions) (8 points) These new functions should have docstrings that clearly explain the input parameters and the return values. They do not need to include test cases. (6 points) The main program should be clear and concise (3 points) - You should use descriptive variable names (3 points) Correctness (20 points) - The Sierpinski Triangle is drawn correctly * It is drawn correctly for a square window (7 points) * It is drawn correctly for a non-square window (4 points) * The first ten points generated are not added to the image. (2 points) The points are colored in a gradient fashion * The correct corners are colored a shade of red, green or blue as described above (2 points) * The colors gradually blend according to their distance from each corner (5 points) Test Cases (5 points) At the bottom of the file you submit include a comment that describes your testing method- ology in prose. Describe in prose how you tested each of the functions you created. Show example function calls you used. Then explain in prose how you tested the program as a whole. 5 More pictures Here's a couple other images so you can see how things can be colored when the window is not square. As long as the gradient is smooth you'll get full points for the coloring scheme you devise. Here's an example of a non-smooth gradient. 6 Optional extra stuff If the idea of a chaos game intrigues you then look at this website: http://mathworld.wolfram.com/ChaosGame.htm). There you can see how what we're doing here is just one specific case of a general idea. The general idea is you can have triangles, squares, pentagons, hexagons, etc. And you when you choose a random corner and find the midpoint you could instead find the point that is 1/3 of the way to the corner, or 3/8 of the way to the corner, etc. A good challenge would be to see if you can write the code for a more general chaos game while keeping your program structured similarly to what you wrote for this assignment. This is not required but feel free to talk to me if you're interested. 1 Overview Lab 6 will cover tuples and random number generation, both of which are used in this program. I suggest you view this document on the computer (as opposed to a black and white print out) so you can see the colors. For this assignment you are to write a Python program which creates a Sierpinski Triangle using a method called a chaos game. The chaos game is played as follows. The user will choose the window size (say 500 by 500 pixels). Denote the three corners of an isosceles triangle 1, 2, 3, where corner 1 is at the top center of the screen, corner 2 is in the lower left of the screen, and corner 3 is in the lower right of the screen. Here's some pseudocode to help you understand how the chaos game works: Let p be a random point in the window loop 10000 times c = random corner of the triangle m = midpoint between p and c color the pixel at m P = m This process will generate a Sierpinski Triangle as pictured below. 2 Details 1. One thing you might notice if you try this on paper (or if you carefully look at the image you generate once it's complete) is that the first few iterations of this game may produce points that are not actually part of the Sierpinski triangle. Thus, you should start the process of generating points, but don't plot the first few points you calculate. To be safe you should start adding points to the image after 10 iterations. 2. I've given you two files, hw3_handout.py and graphics.py, which are both available on Canvas. I'd like to give credit to John Zelle who wrote the graphics.py package. John Zelle did a good job of simplifying some tricky things in Python to make it easy to open a window and to plot points of a particular color in that window. This file should be in the same directory as the program you're writing. The hw3_handout.py file will get you started with a few lines of code that show you the basic graphics functions you will use for this project. These lines of code just take some input from the user and open a window of the desired size. Then I show how to plot four adjacent points in the window (I showed four adjacent pixels because sometimes it's hard to see just one). 3. The RGB color scheme is a commonly used system of representing a color. Part of the graphics.py package is a function called color_rgb() which takes three parameters. Each of the parameters is an integer value from 0 to 255 that represents a color. For instance (255, 0, 0) is red, 0,255,0) is green and (0, 0, 255) is blue. Furthermore, (255, 255, 255) is white and (0,0,0) is black. Also, I want to point out how the window is structured. The upper left corner of the window is position (0,0) and the bottom right is position (width, height), the top right is position (width,0) and the bottom left is position (0,height). Thus, the first coordinate is the x coordinate and the second coordinate is the y coordinate, but, unlike the first quadrant of the Cartesian coordinate system, the y axis increases as you move down the window. Thus, to set a particular pixel to a color you say: win.plot(x, y, color_rgb(red, green, blue)) where x and y are the coordinates of the point and red, green, blue are integer values between 0 and 255 for the amount of red, green and blue of the color of the point you want to plot. In the handout I show you how to plot four red points near the center of the window you defined. 4. If you simply followed the pseudocode at the top of this document and set each pixel to black then you'd have a black and white version of the Sierpinski triangle. That's a good first step to make sure your chaos procedure is working correctly. However, I want you to color the triangle to make it prettier! I'm letting you get creative with this step but the basic idea I want you to follow is that each corner is a "base" color (e.g. red, green or blue). Set up three variables called corneri, corner2, corner3 as follows: corner1 = (width//2, 0) corner2 = (0,height) corner3 = (width, height) # the red corner (top middle of window) # the green corner (lower left of window) # the blue corner (lower right of window) Notice that each of these variables is a 2-tuple (because I used parentheses). Also notice that I am referring to a base color for each corner in the comments. Stick to these base color assignments to make the TAs' job easier. The color of other points that you plot should be blended according to how far they are from each corner and there should be a nice gradient across the triangle. This is not too difficult in a square window but you need to be a little more careful in a non-square window (when the width of the window is not equal to the height of the window). 3 Hints 1. In lab you wrote a midpoint function. Use it as is or modify it slightly for this program. 2. Drawing a black and white triangle is a great first step. Once that is working then all you have to do is come up with a coloring scheme and instead of assigning black to each new pixel when you calculate its location you can call a function to generate a color based on the point's distance from each corner and assign that color to the new pixel. You also wrote a distance function in lab, you can make use of that here to compute the distance to each corner. 3. I used three 2-tuples to represent the three corner points of the triangle (notice how I did that by including the x and y coordinates inside parentheses. The parentheses tell Python that this is a tuple. Please observe this convention. We could just create six variables x1, yl, x2, 42, 23, y3 but I think it's cleaner to pass the points to functions as 2-tuples so we're passing only three variables. 4. Turn in code that draws 50000 points. Note that each time you plot a new point the computer redraws the image in its entirety which gets "harder" to do as there are more points to draw. Thus, the first 10000 iterations will actually happen faster than the last 10000. You are welcome to test this with 100000 points or 200000 points but that will take significantly longer than 50000 points but the resolution of the image will be better with more points generally speaking. 4 Grading Rubric Style and Clarity (20 points) You should add at least two functions to this program and no more than four (FYI my program had three additional functions) (8 points) These new functions should have docstrings that clearly explain the input parameters and the return values. They do not need to include test cases. (6 points) The main program should be clear and concise (3 points) - You should use descriptive variable names (3 points) Correctness (20 points) - The Sierpinski Triangle is drawn correctly * It is drawn correctly for a square window (7 points) * It is drawn correctly for a non-square window (4 points) * The first ten points generated are not added to the image. (2 points) The points are colored in a gradient fashion * The correct corners are colored a shade of red, green or blue as described above (2 points) * The colors gradually blend according to their distance from each corner (5 points) Test Cases (5 points) At the bottom of the file you submit include a comment that describes your testing method- ology in prose. Describe in prose how you tested each of the functions you created. Show example function calls you used. Then explain in prose how you tested the program as a whole. 5 More pictures Here's a couple other images so you can see how things can be colored when the window is not square. As long as the gradient is smooth you'll get full points for the coloring scheme you devise. Here's an example of a non-smooth gradient. 6 Optional extra stuff If the idea of a chaos game intrigues you then look at this website: http://mathworld.wolfram.com/ChaosGame.htm). There you can see how what we're doing here is just one specific case of a general idea. The general idea is you can have triangles, squares, pentagons, hexagons, etc. And you when you choose a random corner and find the midpoint you could instead find the point that is 1/3 of the way to the corner, or 3/8 of the way to the corner, etc. A good challenge would be to see if you can write the code for a more general chaos game while keeping your program structured similarly to what you wrote for this assignment. This is not required but feel free to talk to me if you're interested
Step by Step Solution
There are 3 Steps involved in it

Get step-by-step solutions from verified subject matter experts