Test: Exam #4 Chapters 8, 11, 12 Question 1 of 14 This test: 14 point(s) possible This question: 1 point(s) possible Submit test Independent random
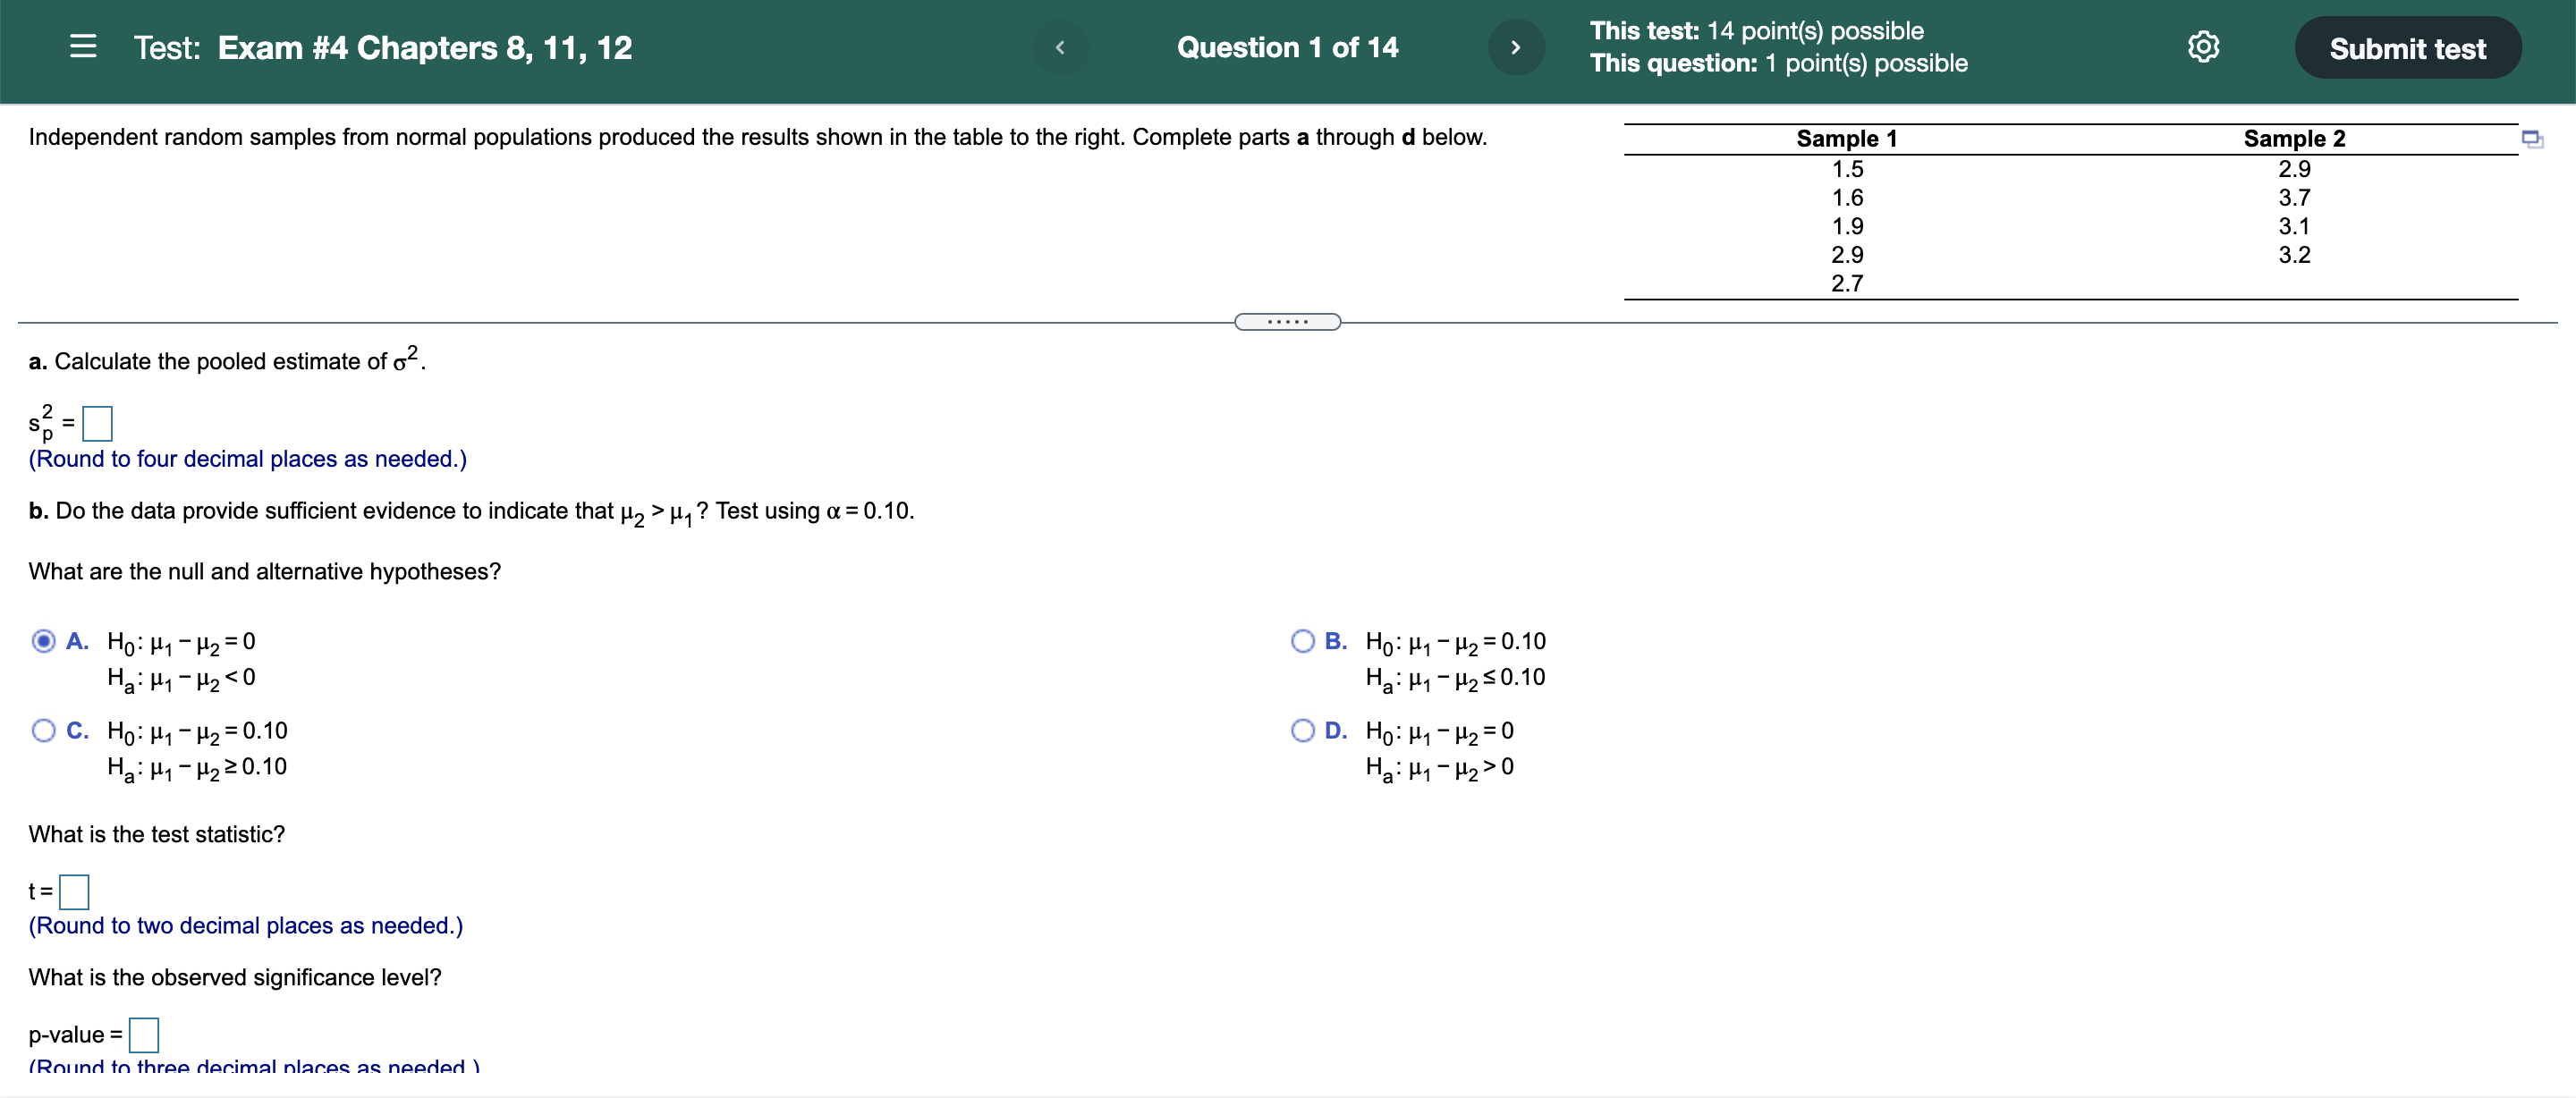
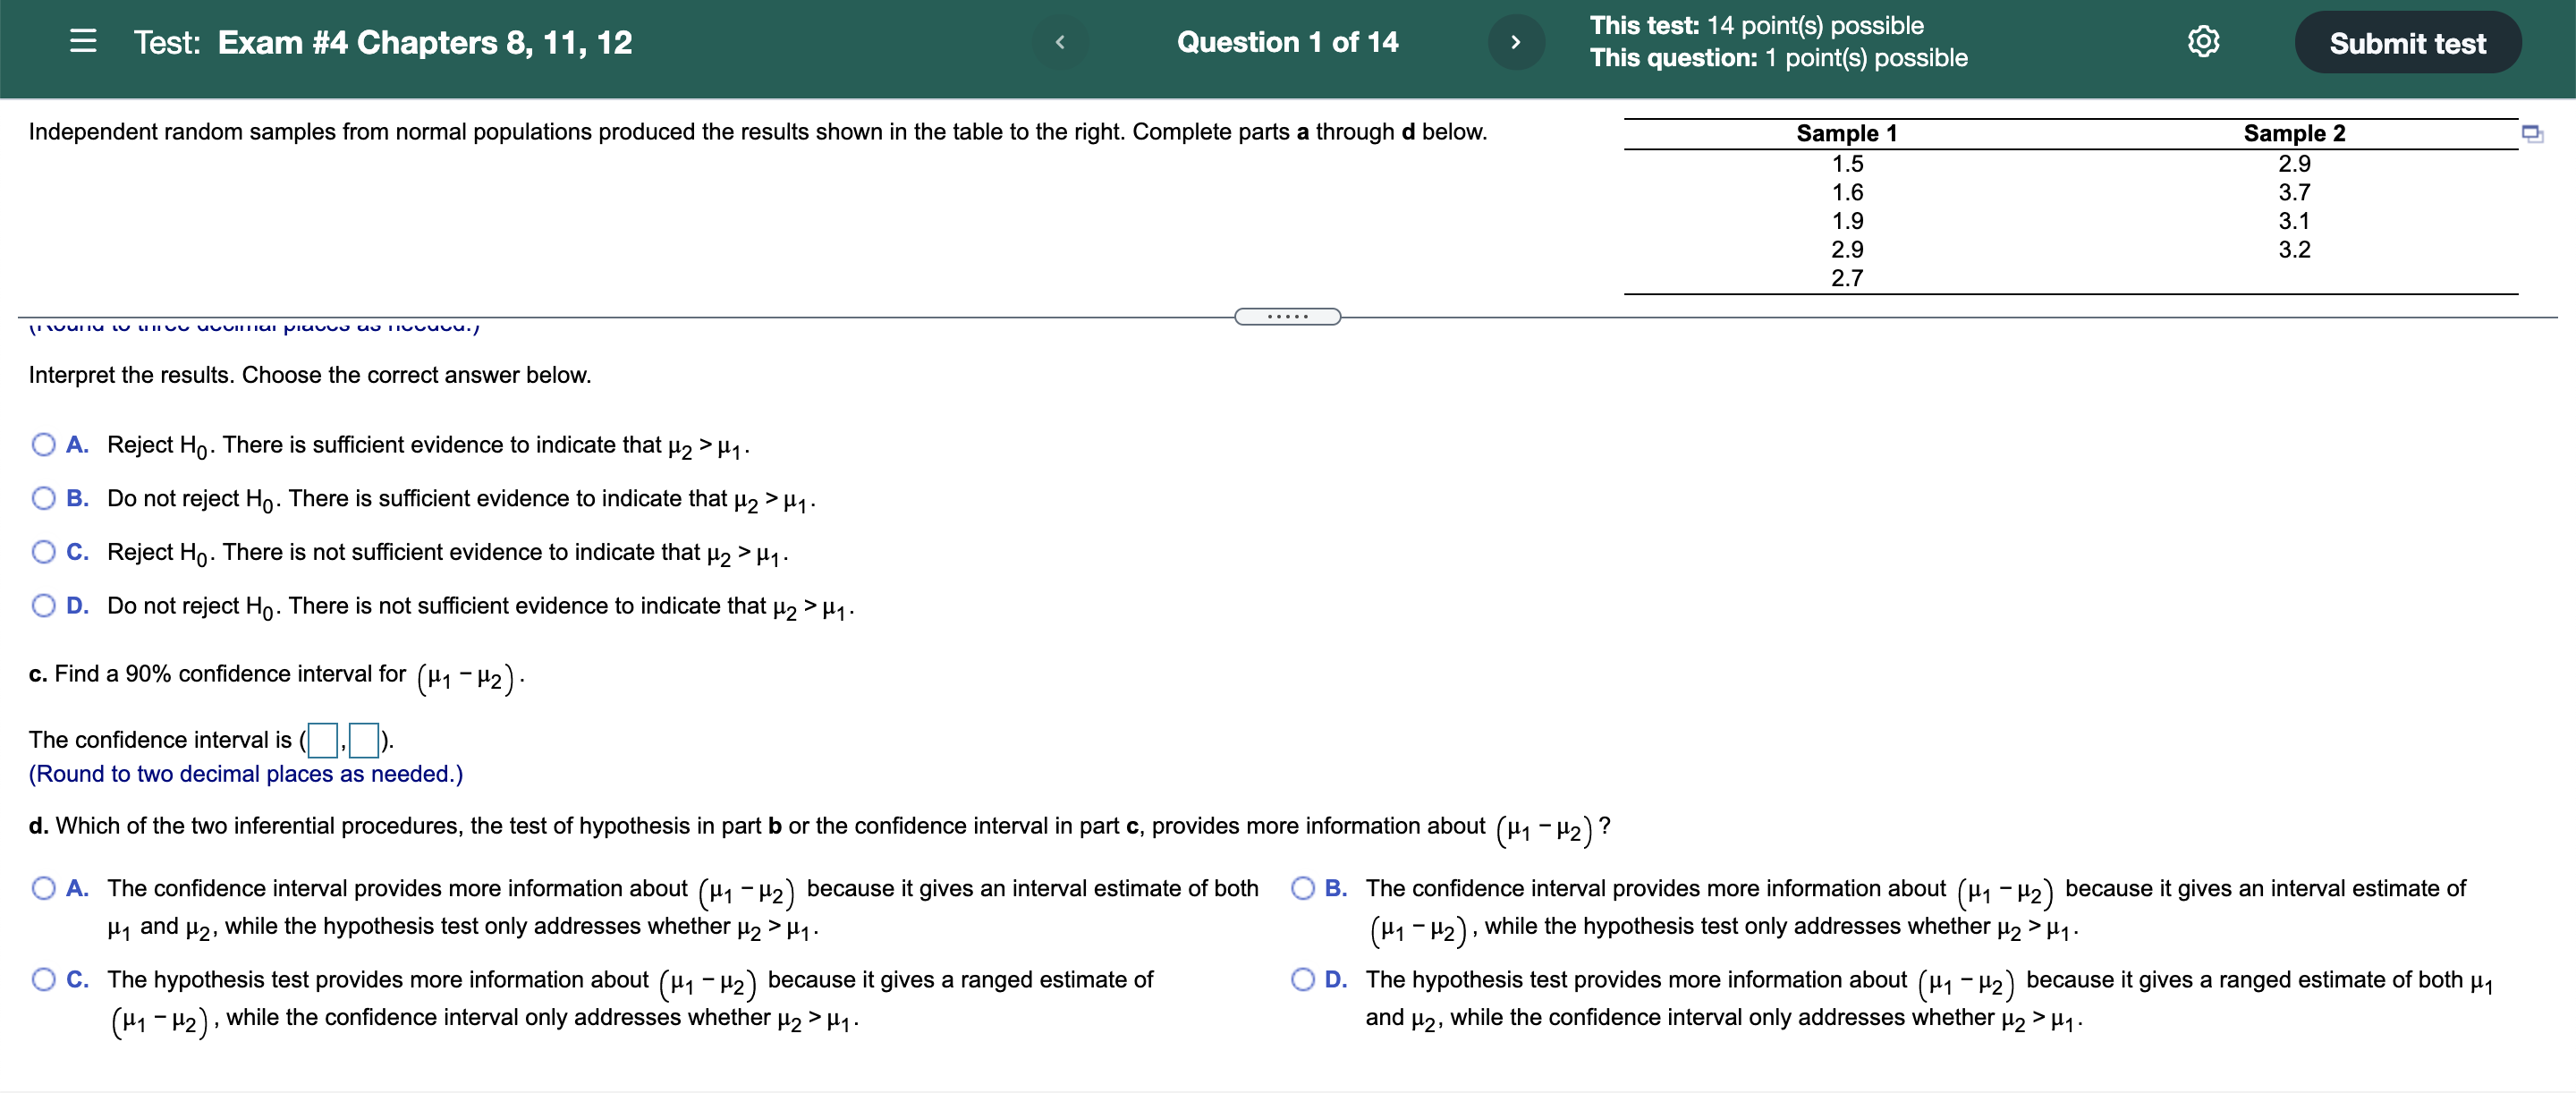
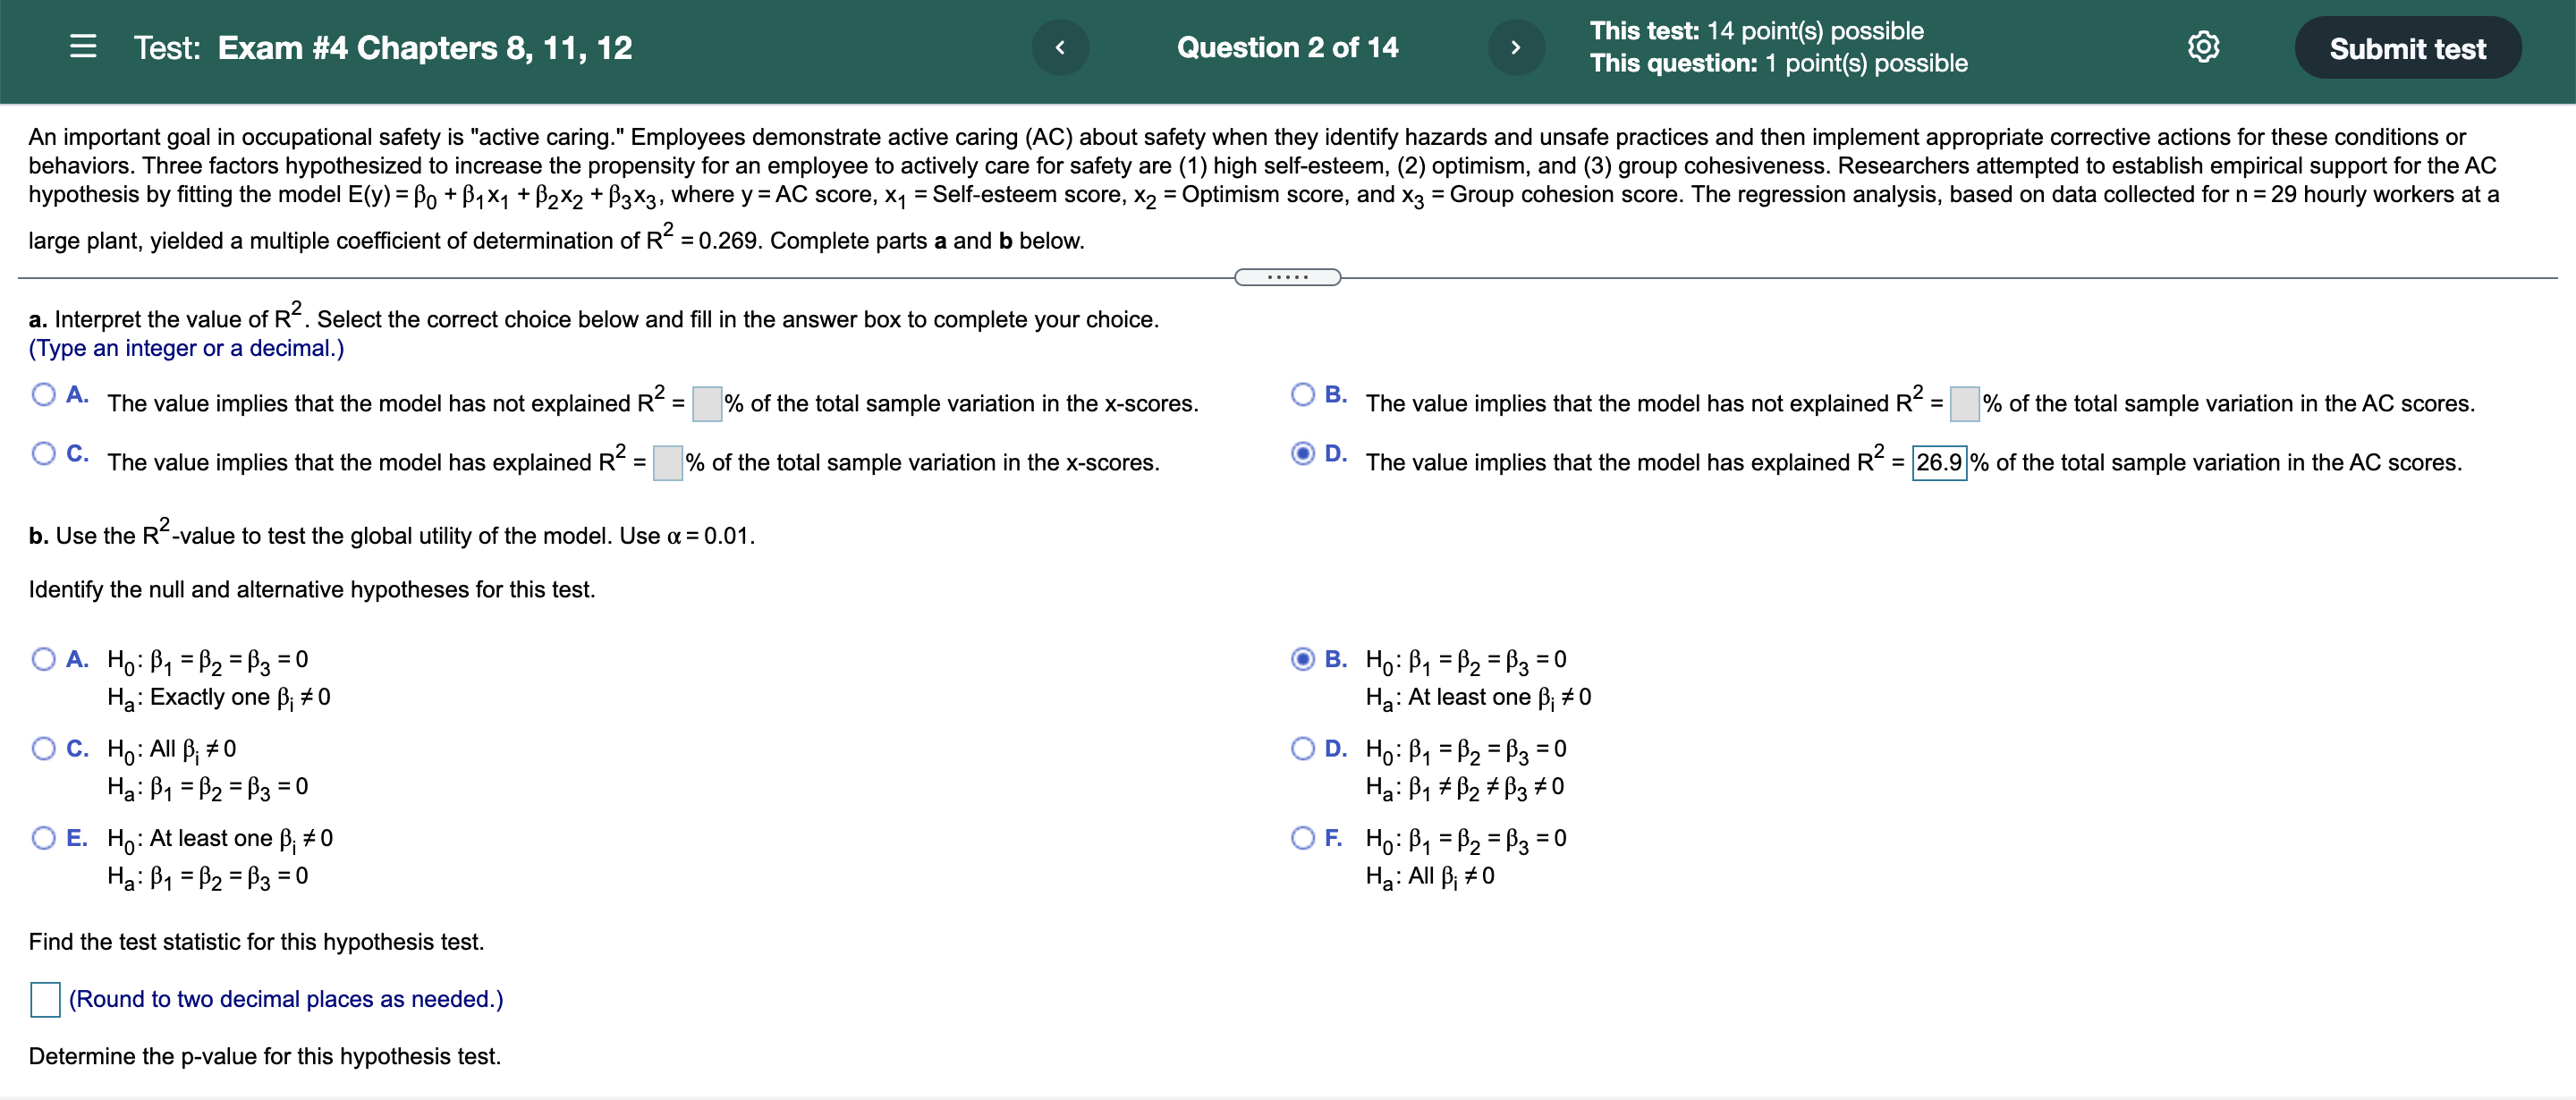
Test: Exam #4 Chapters 8, 11, 12 Question 1 of 14 This test: 14 point(s) possible This question: 1 point(s) possible Submit test Independent random samples from normal populations produced the results shown in the table to the right. Complete parts a through d below. Sample 1 Sample 2 1.5 2.9 1.6 3.7 1.9 3.1 2.9 3.2 2.7 a. Calculate the pooled estimate of o2. Sp =] (Round to four decimal places as needed.) b. Do the data provide sufficient evidence to indicate that H2 > , ? Test using a = 0.10. What are the null and alternative hypotheses? O A. HO: H1 - H2= 0 OB. HO: M1 - H2= 0.10 Ha: H1 - H20 What is the test statistic? 1= (Round to two decimal places as needed.) What is the observed significance level? p-value = (Round to three decimal places as needed )Test: Exam #4 Chapters 8, 11, 12 Question 1 of 14 This test: 14 point(s) possible This question: 1 point(s) possible Submit test Independent random samples from normal populations produced the results shown in the table to the right. Complete parts a through d below. Sample 1 Sample 2 1.5 2.9 1.6 3.7 1.9 3.1 2.9 3.2 2.7 . . . . . Interpret the results. Choose the correct answer below. O A. Reject Ho. There is sufficient evidence to indicate that #2 > H1. O B. Do not reject Ho. There is sufficient evidence to indicate that #2 > H1. O C. Reject Ho. There is not sufficient evidence to indicate that H2 > M1. O D. Do not reject Ho. There is not sufficient evidence to indicate that H2 > M1. c. Find a 90% confidence interval for (H1 - H2) - The confidence interval is (,). (Round to two decimal places as needed.) d. Which of the two inferential procedures, the test of hypothesis in part b or the confidence interval in part c, provides more information about (H1 - H2) ? A. The confidence interval provides more information about (H1 - H2 ) because it gives an interval estimate of both O B. The confidence interval provides more information about (H1 - H2) because it gives an interval estimate of H1 and H2, while the hypothesis test only addresses whether H2 > H1. (H1 - H2) , while the hypothesis test only addresses whether #2 > My. O C. The hypothesis test provides more information about (M1 - H2 ) because it gives a ranged estimate of O D. The hypothesis test provides more information about (H1 - H2 ) because it gives a ranged estimate of both 1 (H1 - H2) , while the confidence interval only addresses whether H2 > My. and H2, while the confidence interval only addresses whether H2 > H1.Test: Exam #4 Chapters 8, 11, 12 Question 2 of 14 This test: 14 point(s) possible This question: 1 point(s) possible Submit test An important goal in occupational safety is "active caring." Employees demonstrate active caring (AC) about safety when they identify hazards and unsafe practices and then implement appropriate corrective actions for these conditions or behaviors. Three factors hypothesized to increase the propensity for an employee to actively care for safety are (1) high self-esteem, (2) optimism, and (3) group cohesiveness. Researchers attempted to establish empirical support for the AC hypothesis by fitting the model E(y) = Po + B1X1 + 2X2 + 3X3, where y = AC score, x, = Self-esteem score, X2 = Optimism score, and X3 = Group cohesion score. The regression analysis, based on data collected for n = 29 hourly workers at a large plant, yielded a multiple coefficient of determination of R = 0.269. Complete parts a and b below. . . . . . a. Interpret the value of R". Select the correct choice below and fill in the answer box to complete your choice. (Type an integer or a decimal.) O A. The value implies that the model has not explained R = % of the total sample variation in the x-scores. O B. The value implies that the model has not explained R" =|% of the total sample variation in the AC scores. C. The value implies that the model has explained R" = % of the total sample variation in the x-scores. OD. The value implies that the model has explained R" = 26.9 % of the total sample variation in the AC scores. b. Use the R-value to test the global utility of the model. Use a = 0.01. Identify the null and alternative hypotheses for this test. O A. HO: B1 = P2 = B3 = 0 OB. Ho: B1 = B2 = B3 = 0 Ha: Exactly one Bi # 0 Ha: At least one Bi # 0 O C. Ho : All B. # 0 OD. Ho: B1 = B2 = P3 = 0 Ha: P1 = P2 = B3 = 0 Ha: B1 # B2 # P3 # 0 O E. Ho: At least one ; # 0 OF. Ho: B1 = B2 = P3= 0 Ha: B1 = B2 = P3 = 0 Ha : All B; # 0 Find the test statistic for this hypothesis test. (Round to two decimal places as needed.) Determine the p-value for this hypothesis test.= Test: Exam #4 Chapters 8, 11, 12 Question 2 of 14 This test: 14 point(s) possible This question: 1 point(s) possible Submit test An important goal in occupational safety is "active caring." Employees demonstrate active caring (AC) about safety when they identify hazards and unsafe practices and then implement appropriate corrective actions for these conditions or behaviors. Three factors hypothesized to increase the propensity for an employee to actively care for safety are (1) high self-esteem, (2) optimism, and (3) group cohesiveness. Researchers attempted to establish empirical support for the AC hypothesis by fitting the model E(y) = Po + 1X1 + 2X2 + 3X3, where y = AC score, X1 = Self-esteem score, X2 = Optimism score, and X3 = Group cohesion score. The regression analysis, based on data collected for n = 29 hourly workers at a large plant, yielded a multiple coefficient of determination of R = 0.269. Complete parts a and b below. O A. Ho: B1 = B2 = B3 = 0 OB. Ho: B1 = B2 = B3 = 0 Ha: Exactly one Bi # 0 Ha: At least one Bi # 0 O C. Ho: All B. # 0 OD. Ho: B 1 = B2 = B3 = 0 Ha: B1 = B2 = B3 = 0 Ha: B1 # B2 # B3 # 0 O E. Ho: At least one ; # 0 OF. Ho: B1 = P2 = P3 = 0 Ha: B1 = B2 = P3 = 0 Ha: All Bi # 0 Find the test statistic for this hypothesis test. (Round to two decimal places as needed.) Determine the p-value for this hypothesis test. 0.290 (Round to three decimal places as needed.) State the conclusion for this hypothesis test. O A. Reject Ho. There is not sufficient evidence to conclude that the model is statistically useful for predicting AC O B. Do not reject Ho. There is not sufficient evidence to conclude that the model is statistically useful for predicting scores AC scores. O C. Reject Ho. There is sufficient evidence to conclude that the model is statistically useful for predicting AC scores. O D. Do not reject Ho. There is sufficient evidence to conclude that the model is statistically useful for predicting AC scores
Step by Step Solution
There are 3 Steps involved in it
Step: 1
Get Instant Access to Expert-Tailored Solutions
See step-by-step solutions with expert insights and AI powered tools for academic success
Step: 2
Step: 3
Ace Your Homework with AI
Get the answers you need in no time with our AI-driven, step-by-step assistance