Answered step by step
Verified Expert Solution
Question
1 Approved Answer
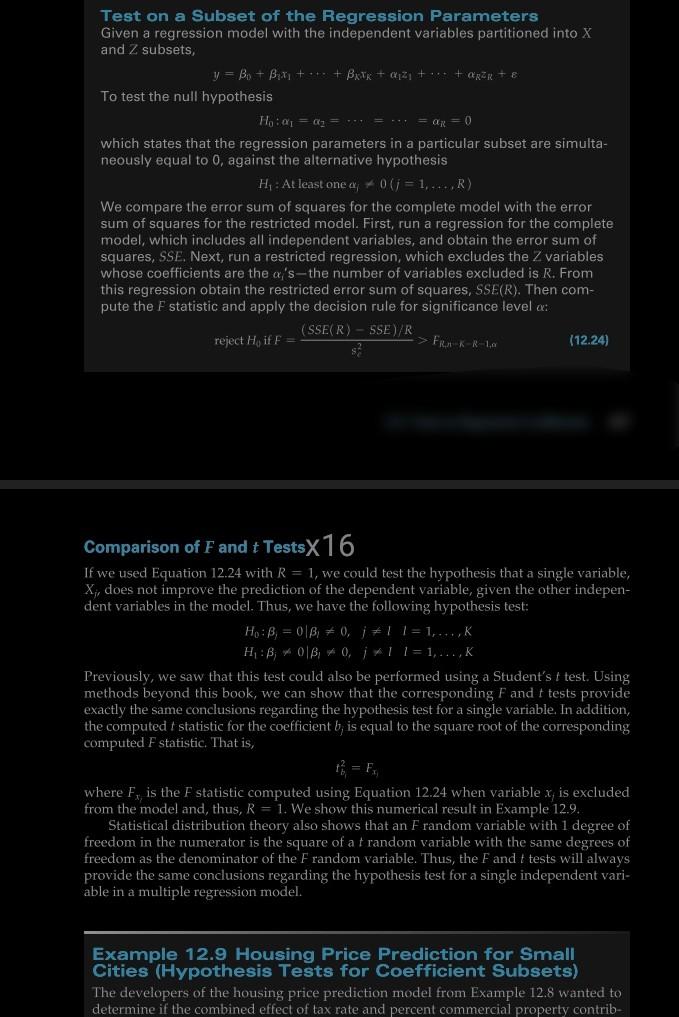
Test on a Subset of the Regression Parameters Given a regression model with the independent variables partitioned into X and Z subsets, y = B

Test on a Subset of the Regression Parameters Given a regression model with the independent variables partitioned into X and Z subsets, y = B + Bx + + + Bar + 421+ + ORR + To test the null hypothesis Ho: a = a1 = = ... = ax = 0 which states that the regression parameters in a particular subset are simulta- neously equal to 0, against the alternative hypothesis H: At least onea - 0 (1 = 1,...R) We compare the error sum of squares for the complete model with the error sum of squares for the restricted model. First, run a regression for the complete model, which includes all independent variables, and obtain the error sum of squares, SSE. Next, run a restricted regression, which excludes the Z variables whose coefficients are the a's-the number of variables excluded is R. From this regression obtain the restricted error sum of squares, SSE(R). Then com- pute the F statistic and apply the decision rule for significance level : (SSE(R) - 5SE/R reject H, if F = > FRIK-R-10 (12.24) s? Comparison of F and t TestsX16 If we used Equation 12.24 with R=1, we could test the hypothesis that a single variable, X;, does not improve the prediction of the dependent variable, given the other indepen- dent variables in the model. Thus, we have the following hypothesis test: Ho:B, = 01B, 0,1 +1 1=1,...,K H: B; OIB, 0, 11=1, ...,K Previously, we saw that this test could also be performed using a Student's t test. Using methods beyond this book, we can show that the corresponding F and t tests provide exactly the same conclusions regarding the hypothesis test for a single variable. In addition, the computed t statistic for the coefficient b, is equal to the square root of the corresponding computed F statistic. That is, where F, is the F statistic computed using Equation 12.24 when variable x; is excluded from the model and, thus, R = 1. We show this numerical result in Example 12.9. Statistical distribution theory also shows that an F random variable with 1 degree of freedom in the numerator is the square of a t random variable with the same degrees of freedom as the denominator of the F random variable. Thus, the F and t tests will always provide the same conclusions regarding the hypothesis test for a single independent vari- able in a multiple regression model. Example 12.9 Housing Price Prediction for Small Cities (Hypothesis Tests for Coefficient Subsets) The developers of the housing price prediction model from Example 12.8 wanted to determine if the combined effect of tax rate and percent commercial property contrib
Step by Step Solution
There are 3 Steps involved in it
Step: 1

Get Instant Access to Expert-Tailored Solutions
See step-by-step solutions with expert insights and AI powered tools for academic success
Step: 2

Step: 3

Ace Your Homework with AI
Get the answers you need in no time with our AI-driven, step-by-step assistance
Get Started


