

Answered step by step
Verified Expert Solution
Question
1 Approved Answer
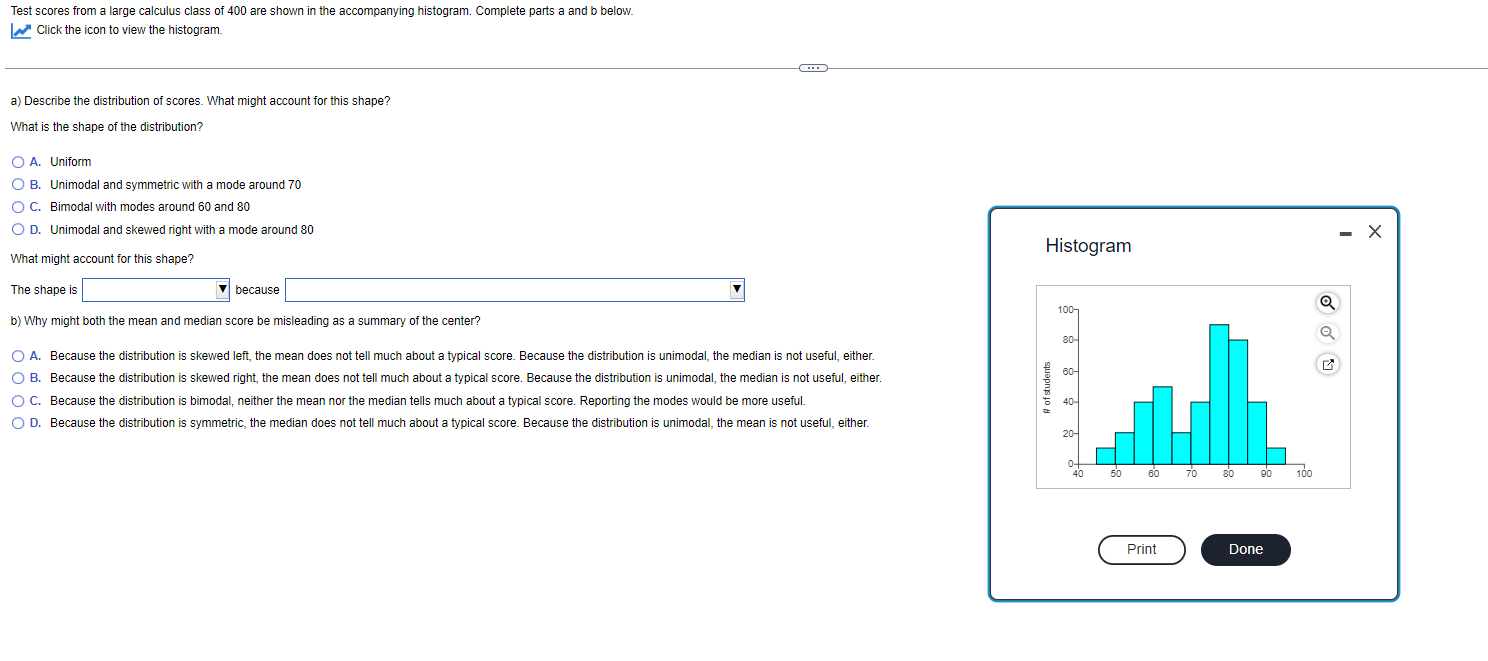
Test scores from a large calculus class of 400 are shown in the accompanying histogram. Complete parts a and b below. Click the icon to

Step by Step Solution
There are 3 Steps involved in it
Step: 1

Get Instant Access to Expert-Tailored Solutions
See step-by-step solutions with expert insights and AI powered tools for academic success
Step: 2

Step: 3
Ace Your Homework with AI
Get the answers you need in no time with our AI-driven, step-by-step assistance
Get Started
Intro Stats
Authors: Richard D De Veaux, Paul F Velleman, David E Bock, Nick Horton
5th Edition
0134668421, 9780134668420