Test Statistics: 2 decimal places
P-Value: 4 decimal places
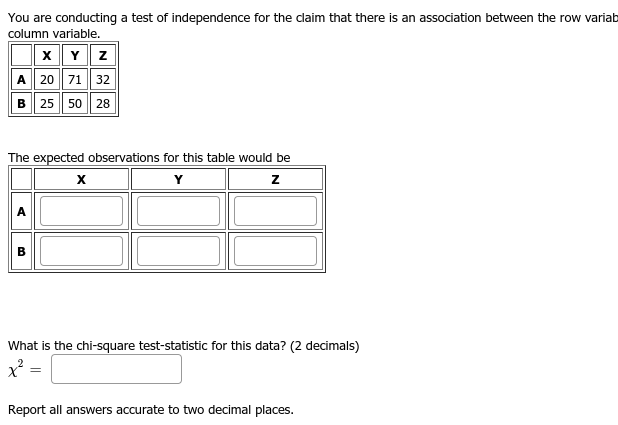
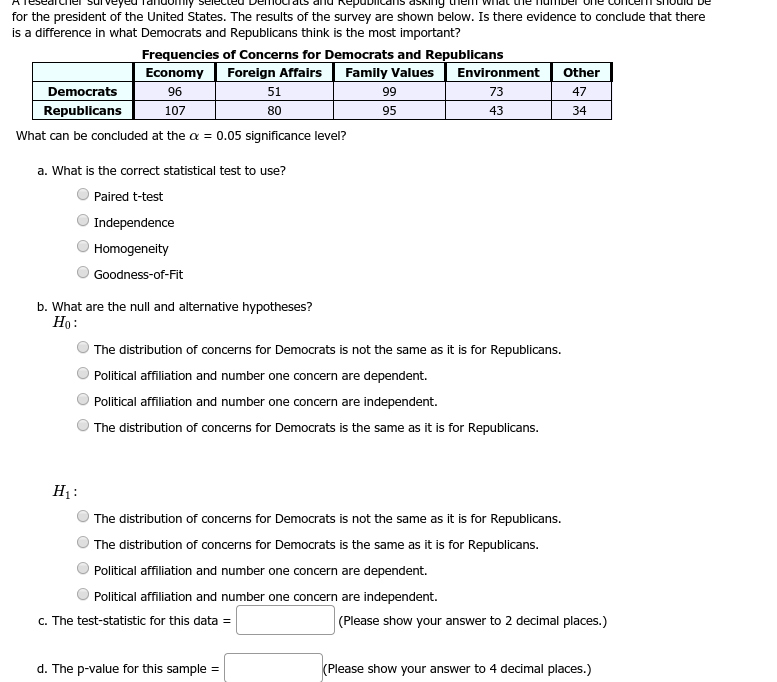
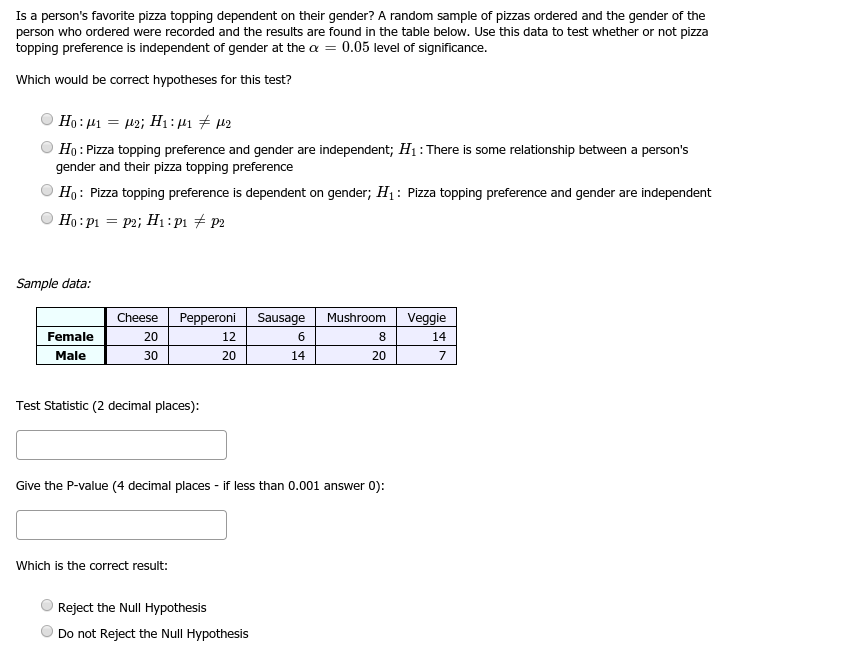
You are conducting a test of independence for the claim that there is an association between the row variab column variable. X Y Z A 20 71 32 B 25 50 28 The expected observations for this table would be X Y Z A B What is the chi-square test-statistic for this data? (2 decimals) X - Report all answers accurate to two decimal places.for the president of the United States. The results of the survey are shown below. Is there evidence to conclude that there is a difference in what Democrats and Republicans think is the most important? Frequencies of Concerns for Democrats and Republicans Economy Foreign Affairs Family Values Environment Other Democrats 16 51 99 73 47 Republicans 107 BO 95 43 34 What can be concluded at the o = 0.05 significance level? a. What is the correct statistical test to use? Paired t-test Independence Homogeneity Goodness-of-Fit b. What are the null and alternative hypotheses? Ho : The distribution of concerns for Democrats is not the same as it is for Republicans. Political affiliation and number one concern are dependent. Political affiliation and number one concern are independent. The distribution of concerns for Democrats is the same as it is for Republicans. H1: The distribution of concerns for Democrats is not the same as it is for Republicans. The distribution of concerns for Democrats is the same as it is for Republicans. Political affiliation and number one concern are dependent. Political affiliation and number one concern are independent. C. The test-statistic for this data = (Please show your answer to 2 decimal places.) d. The p-value for this sample = (Please show your answer to 4 decimal places.)Is a person's favorite pizza topping dependent on their gender? A random sample of pizzas ordered and the gender of the person who ordered were recorded and the results are found in the table below. Use this data to test whether or not pizza topping preference is independent of gender at the or = 0.05 level of significance. Which would be correct hypotheses for this test? Ho: #1 = 12; H1: 1 # #2 Ho: Pizza topping preference and gender are independent; 1 : There is some relationship between a person's gender and their pizza topping preference Ho: Pizza topping preference is dependent on gender; $1 : Pizza topping preference and gender are independent O Ho: p1 = p2; Hi : pi # P2 Sample data: Cheese Pepperoni Sausage Mushroom Veggie Female 20 12 6 8 14 Male 30 20 14 20 7 Test Statistic (2 decimal places): Give the P-value (4 decimal places - if less than 0.001 answer 0): Which is the correct result: Reject the Null Hypothesis Do not Reject the Null Hypothesis


