

Answered step by step
Verified Expert Solution
Question
1 Approved Answer
Test: Week 2 Test ... Test: Week2Test... Question 18 This Test: 100 pts possible @ Submit Test The table below lists measured amounts of redshift
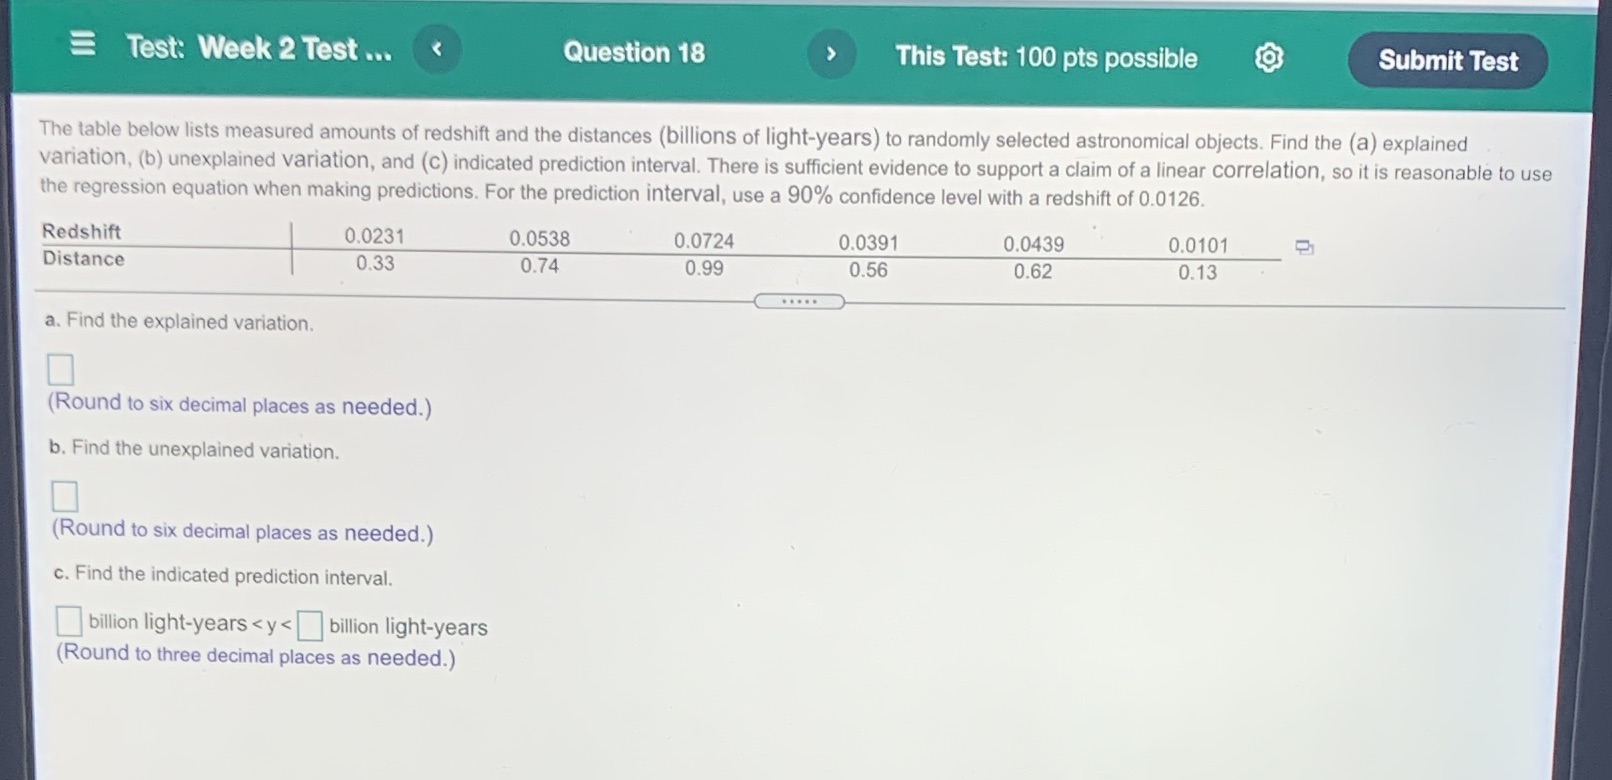
Test: Week2Test... Question 18 This Test: 100 pts possible @ Submit Test The table below lists measured amounts of redshift and the distances (billions of light-years) to randomly selected astronomical objects. Find the (a) explained variation, (b) unexplained variation, and (c) indicated prediction interval. There is sufficient evidence to support a claim of a linear correlation, so it is reasonable to use the regression equation when making predictions. For the prediction interval, use a 90% confidence level with a redshift of 0.0126. Redshift Distance 00231 003 0.0538 074 0.0724 089 0.0391 0.56 0.0439 0.62 0.0101 0.13 a. Find the explained variation. (Round to Six decimal places as needed.) b. Find the unexplained variation. (Round to six decimal places as needed.) c. Find the indicated prediction interval. billion light-years < y < billion light-years (Round to three decimal places as needed.)
Step by Step Solution
There are 3 Steps involved in it
Step: 1

Get Instant Access to Expert-Tailored Solutions
See step-by-step solutions with expert insights and AI powered tools for academic success
Step: 2

Step: 3
Ace Your Homework with AI
Get the answers you need in no time with our AI-driven, step-by-step assistance
Get Started
Theory And Applications Of Partial Functional Differential Equations
Authors: Abrar A Khan
1st Edition
9353141915, 9789353141912