Thank you for your help! This will help me study for my exam. Question 31 (1 point) _II Which of the following is not an
Thank you for your help! This will help me study for my exam.
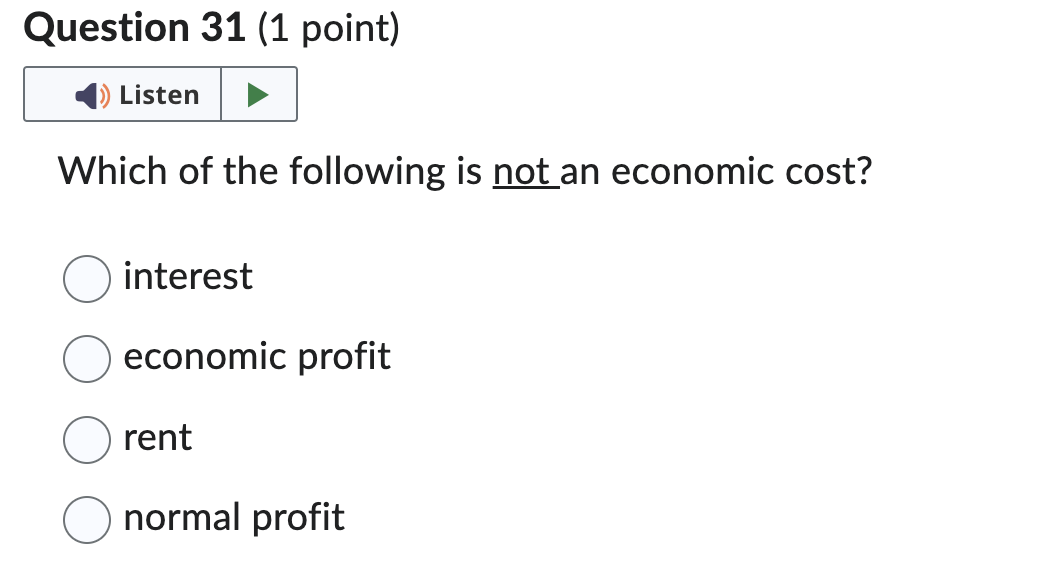
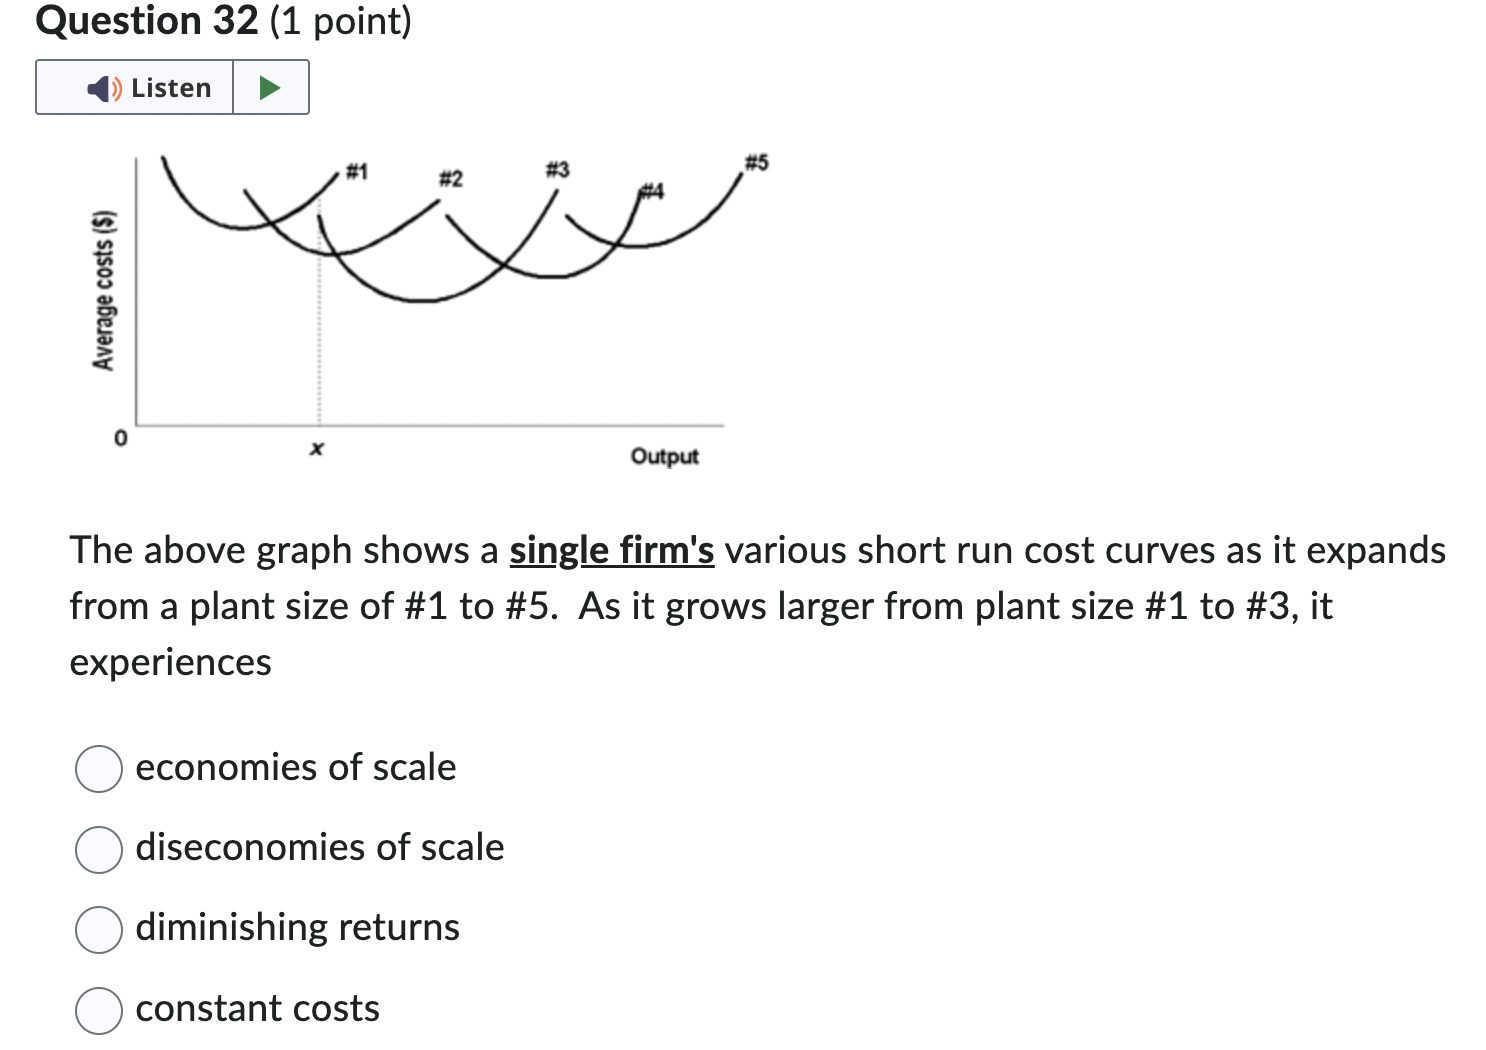
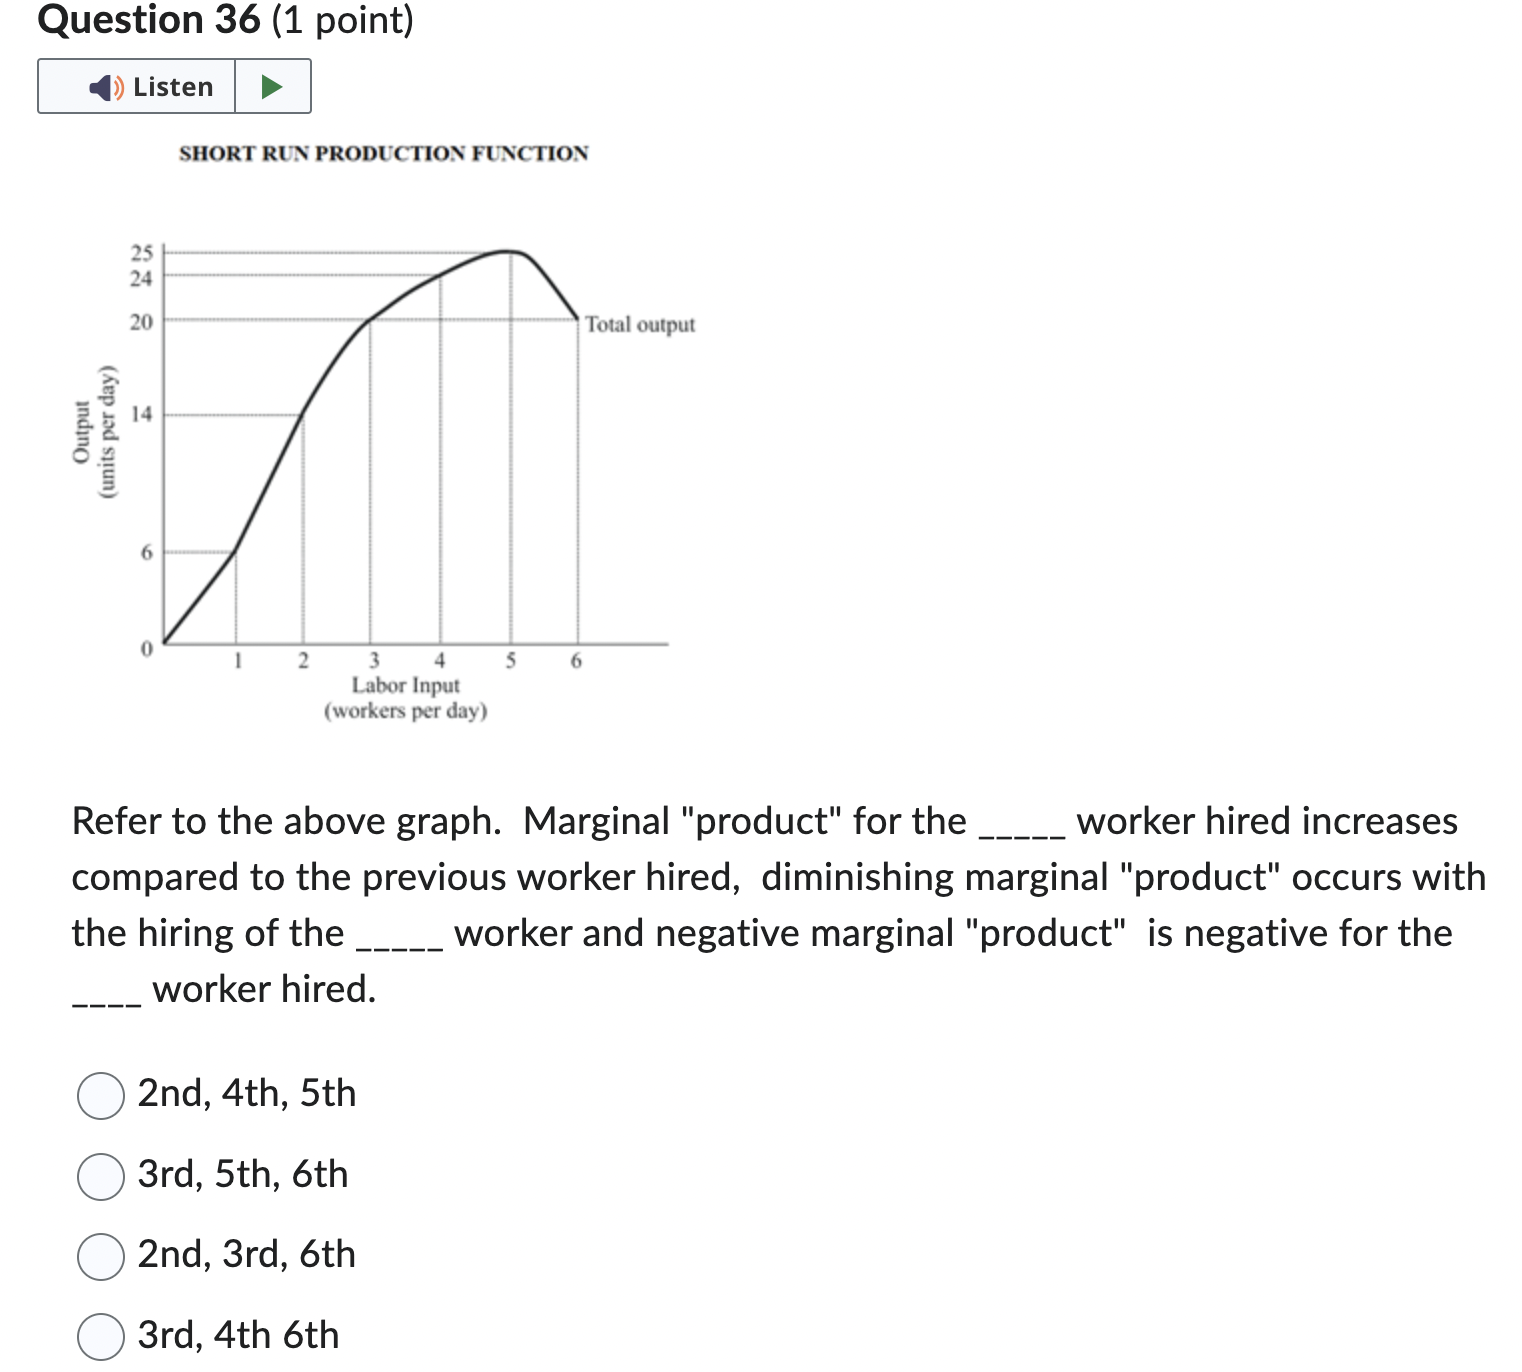
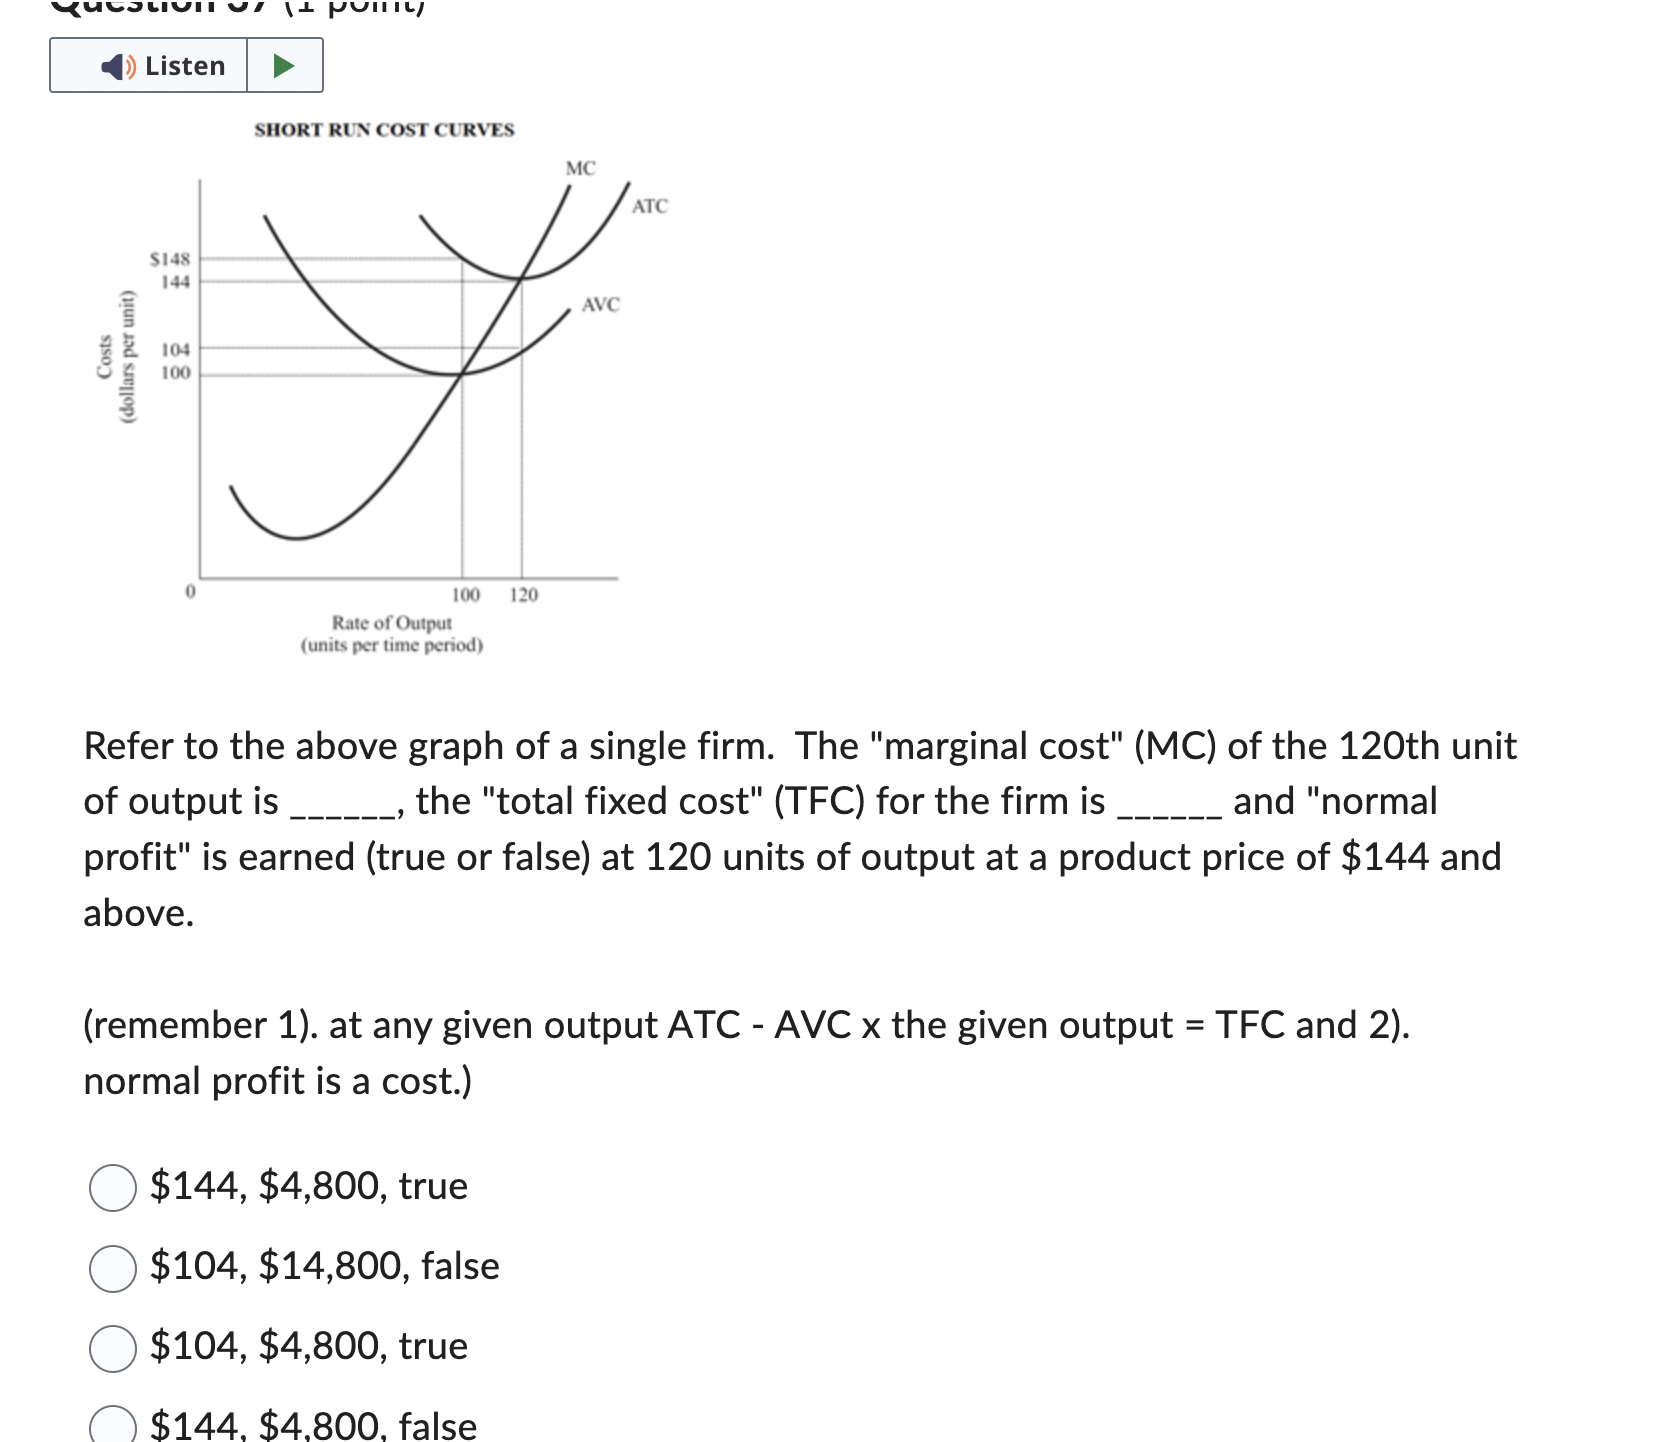
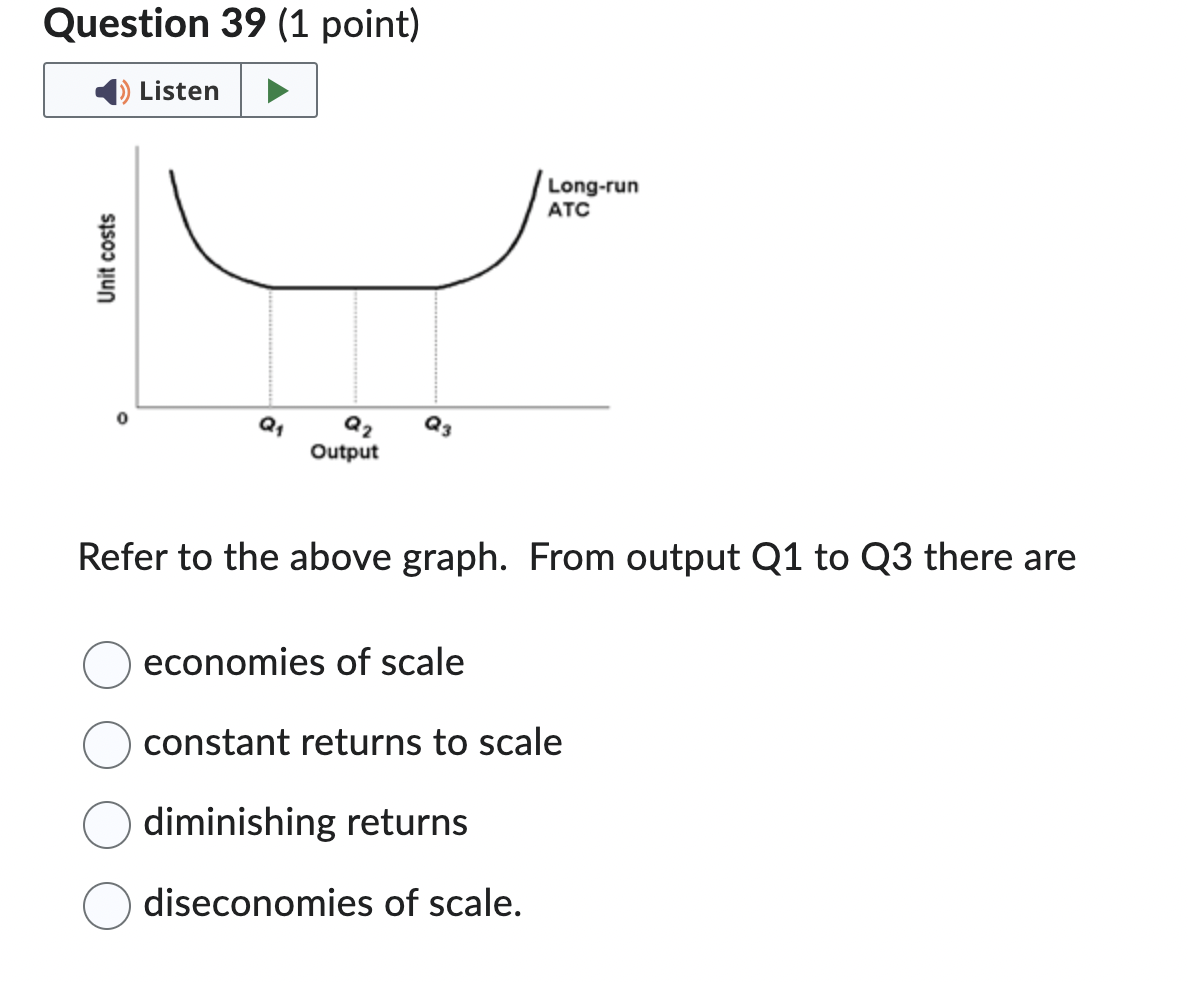
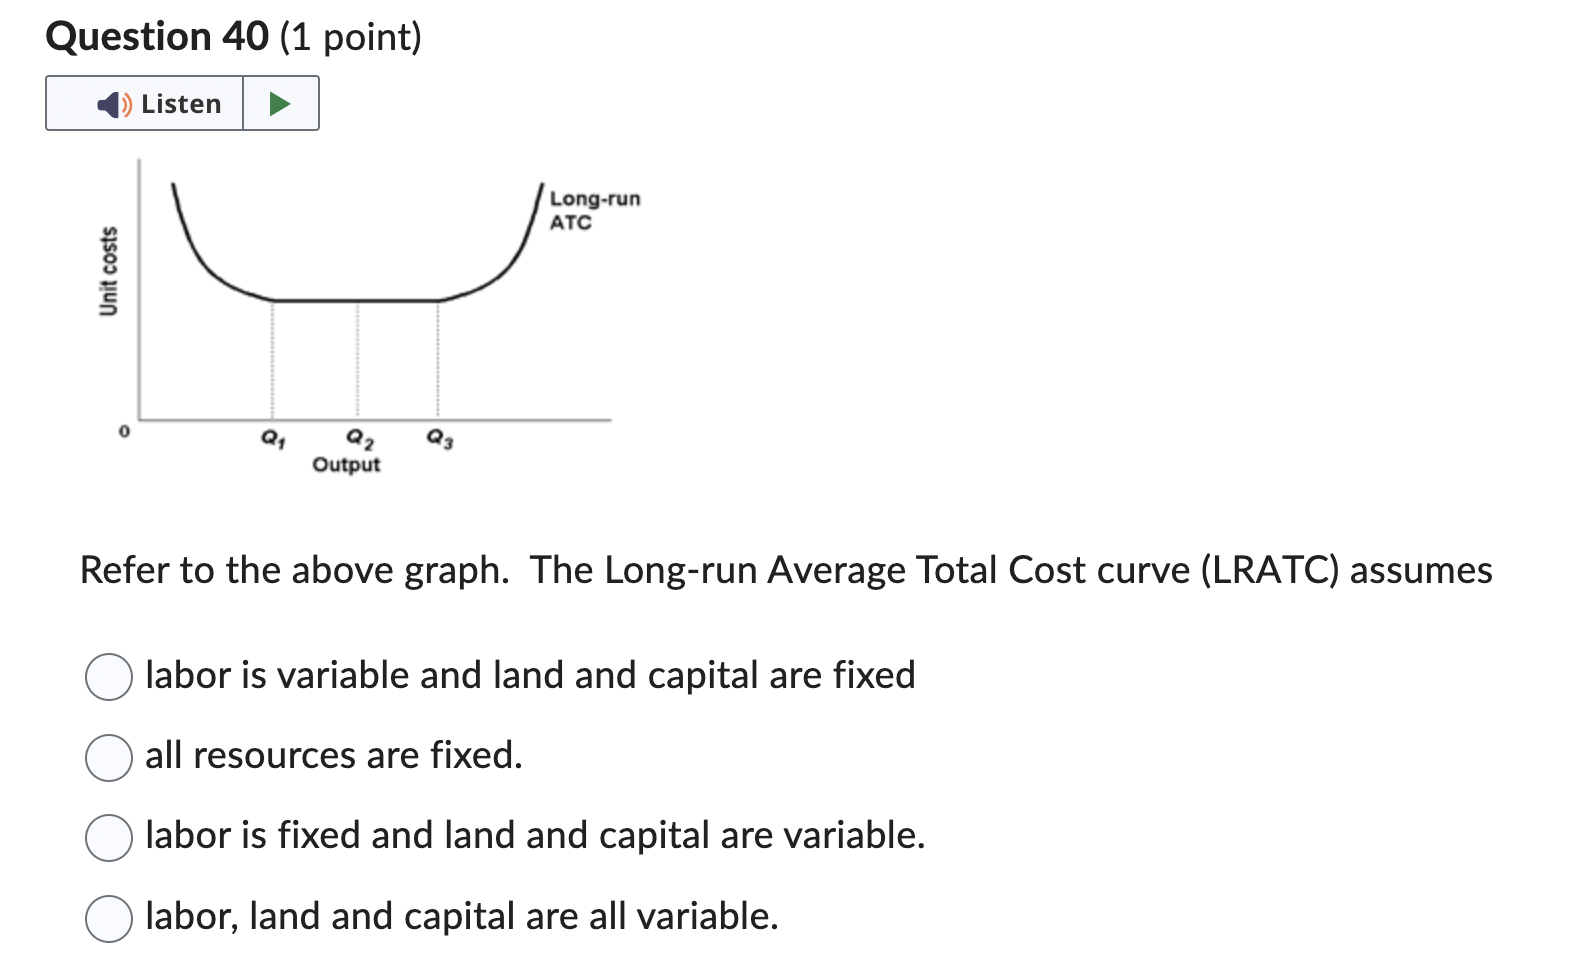
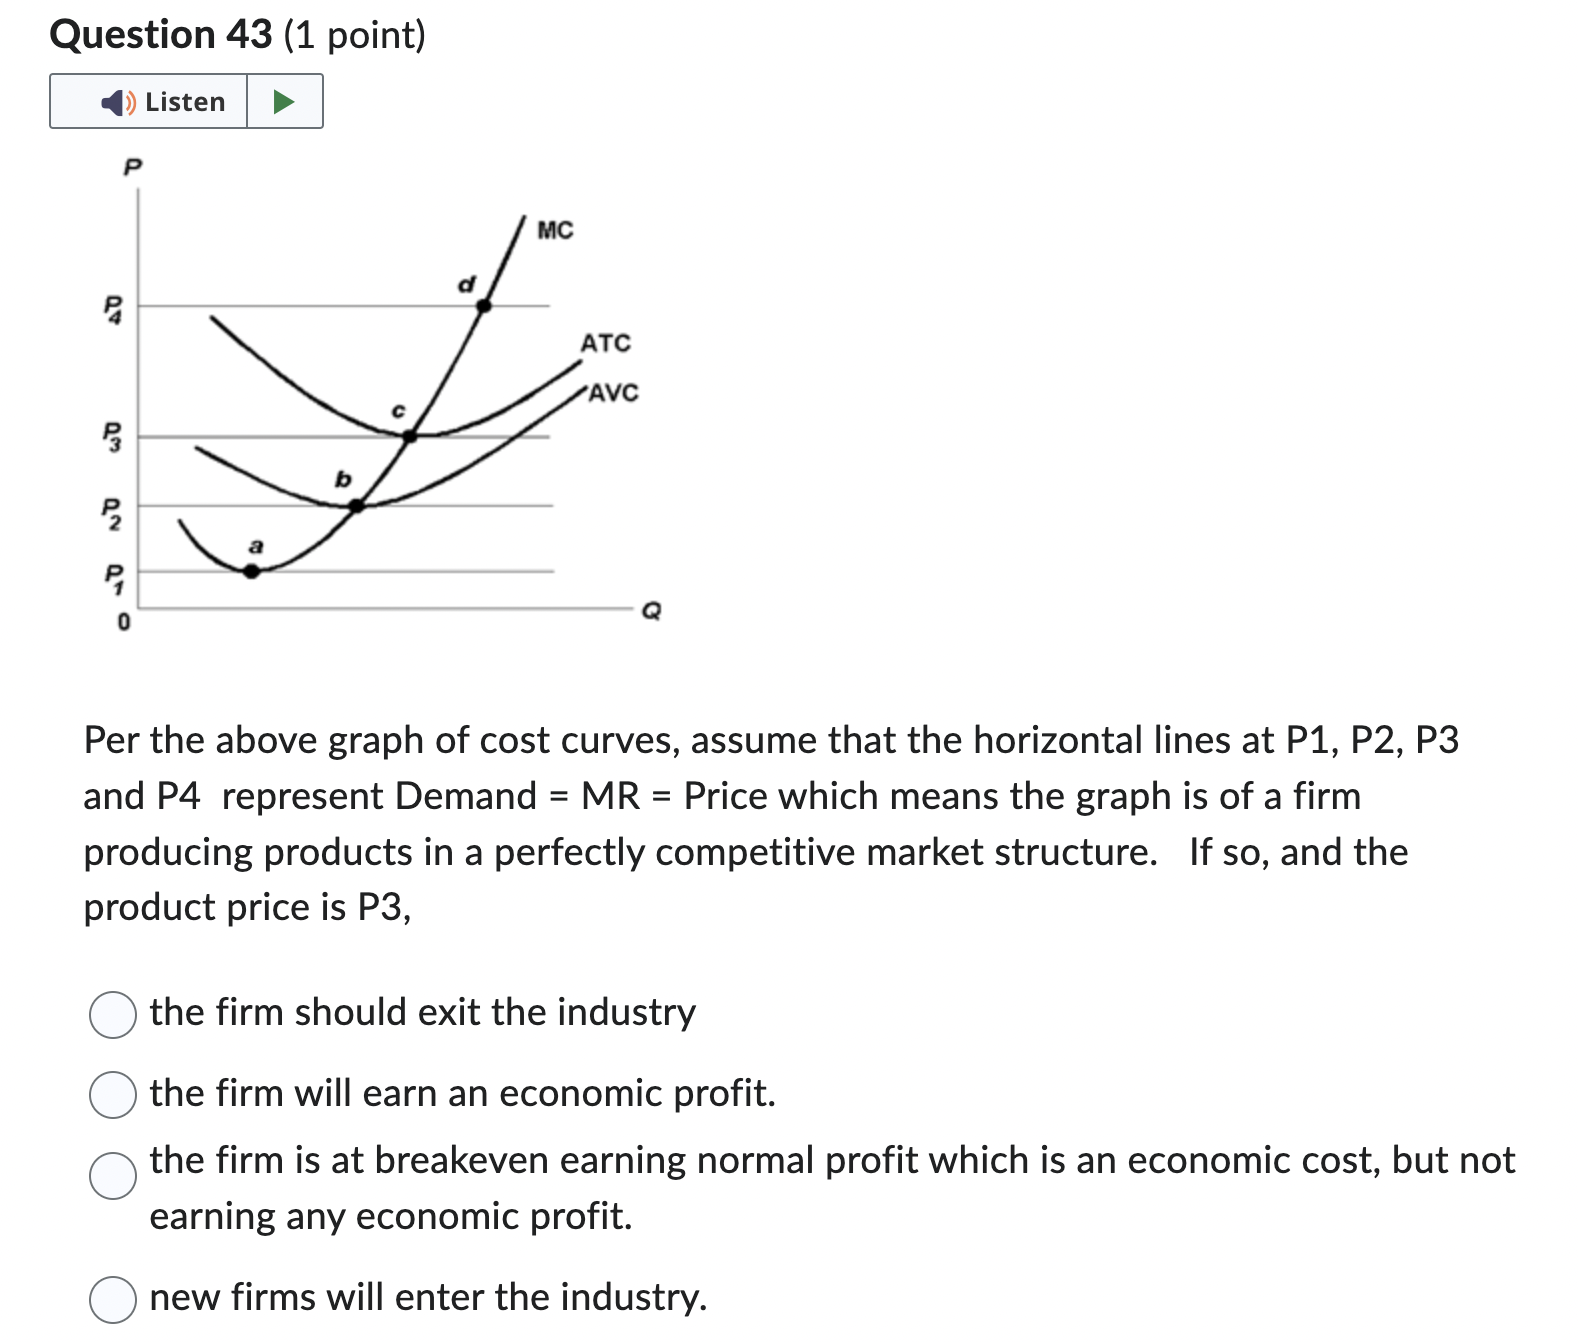
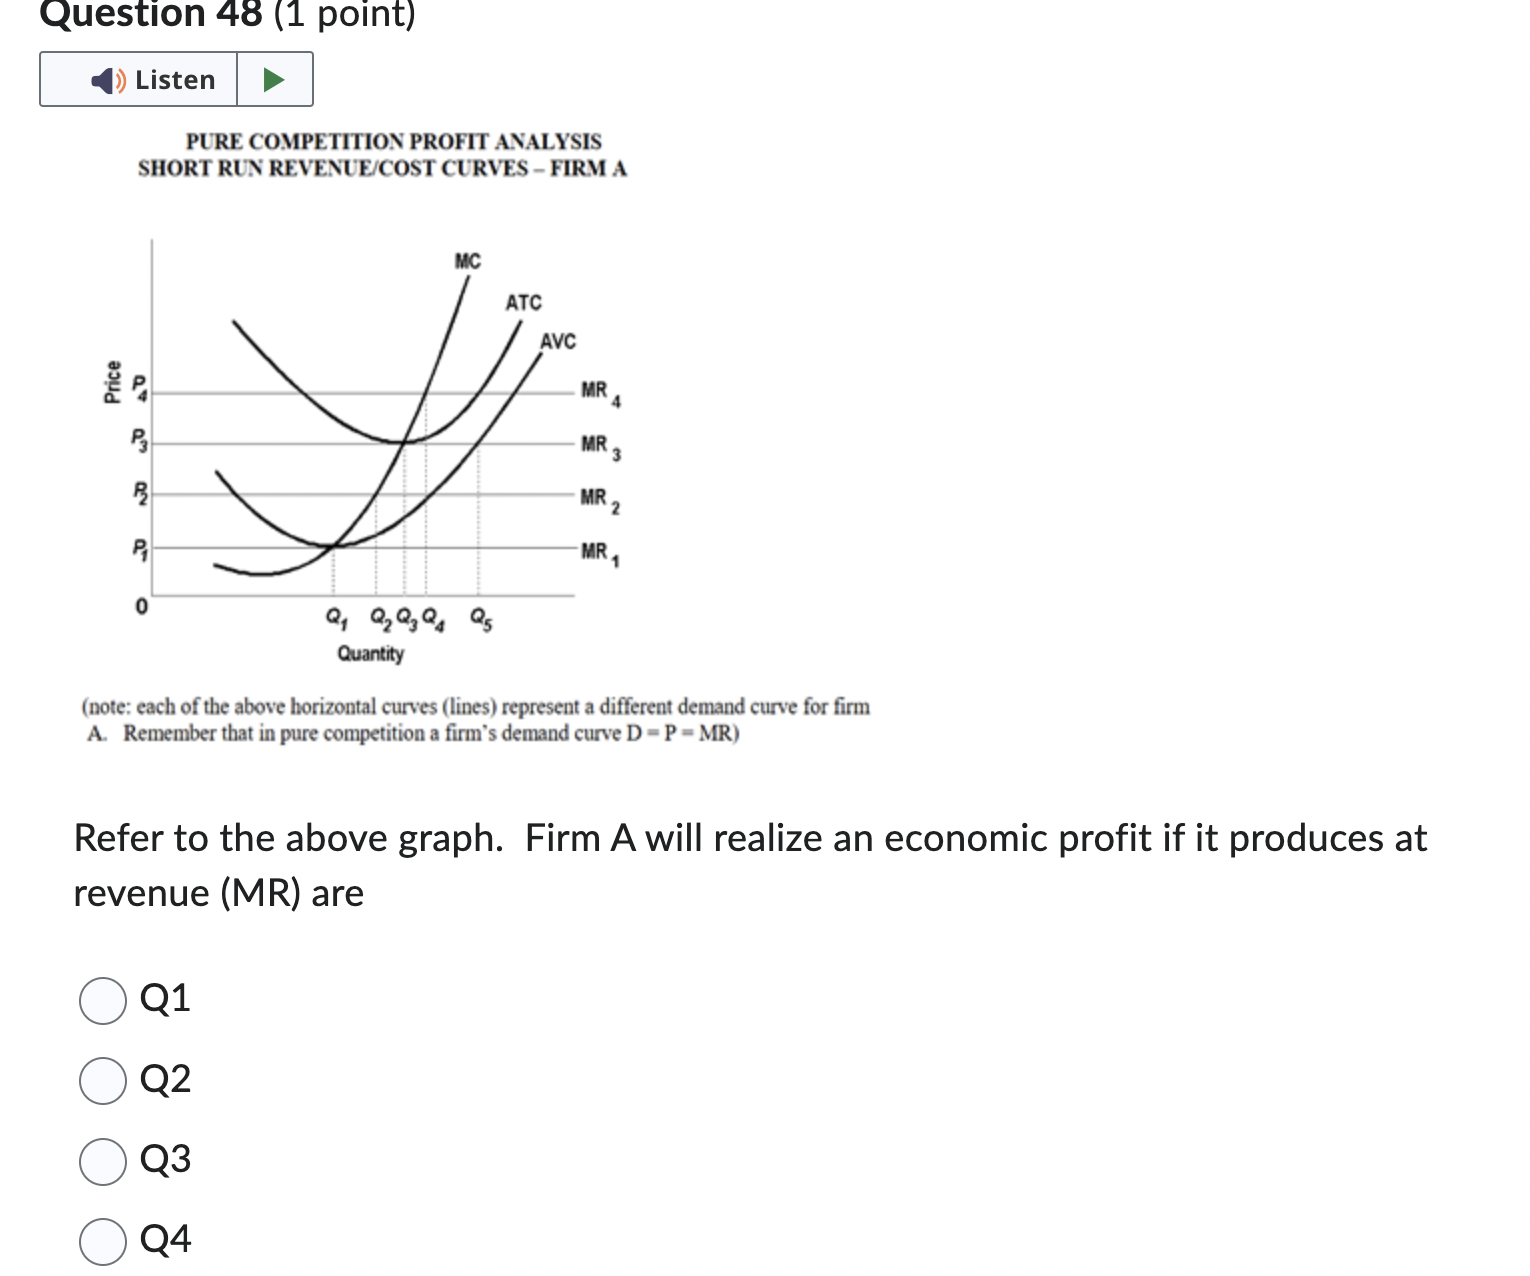
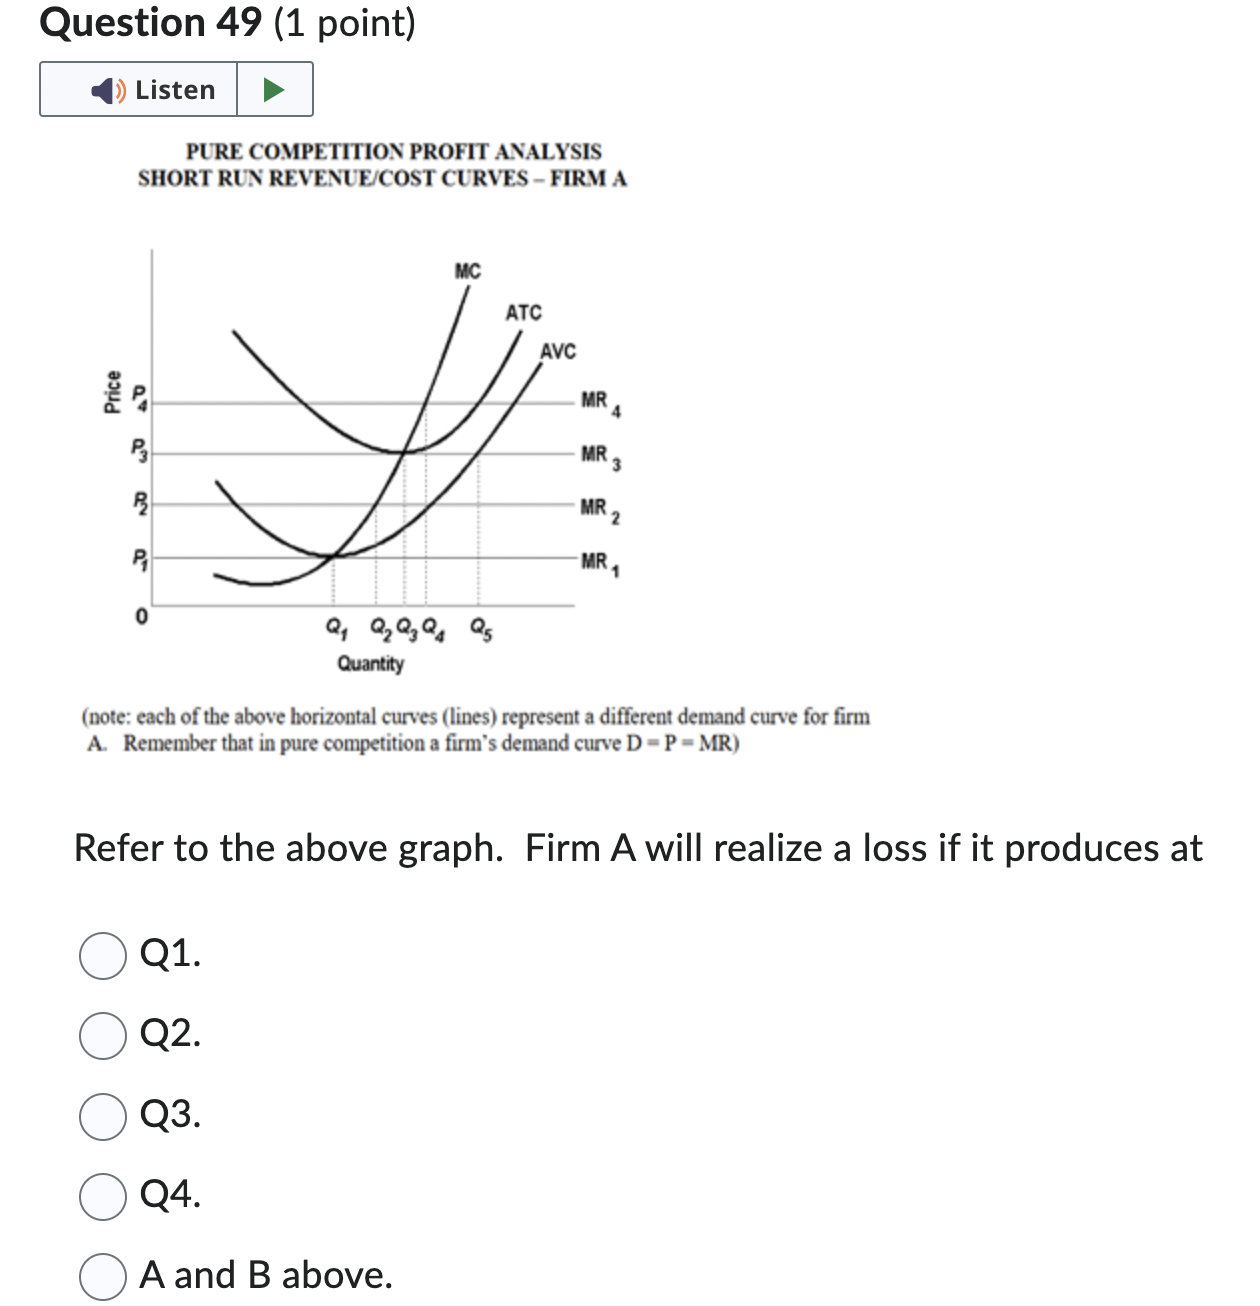
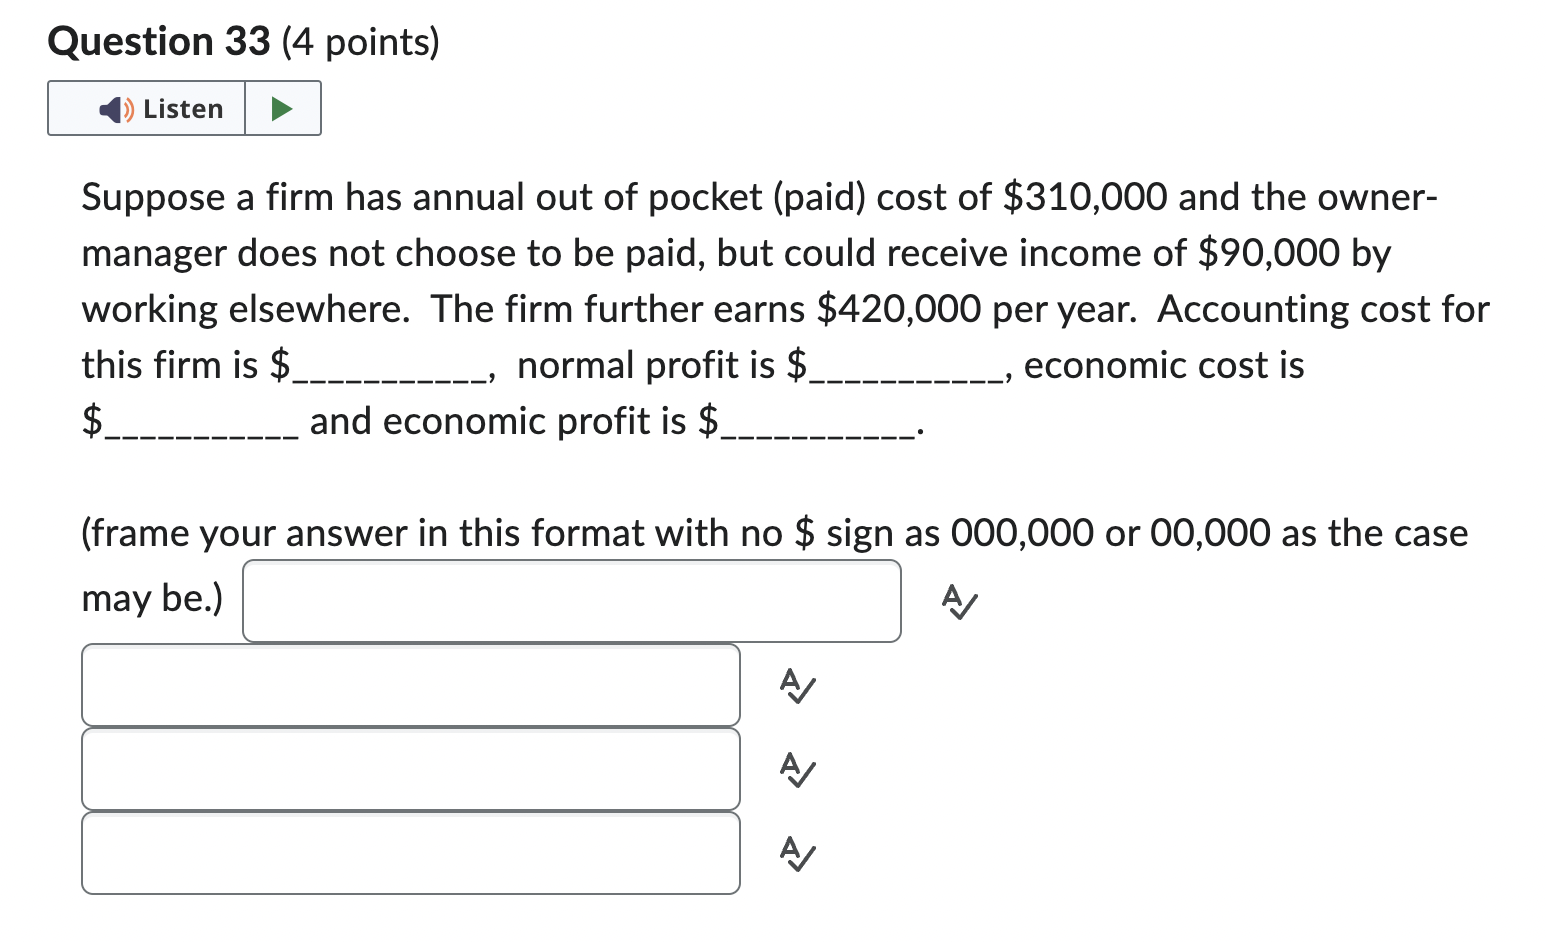
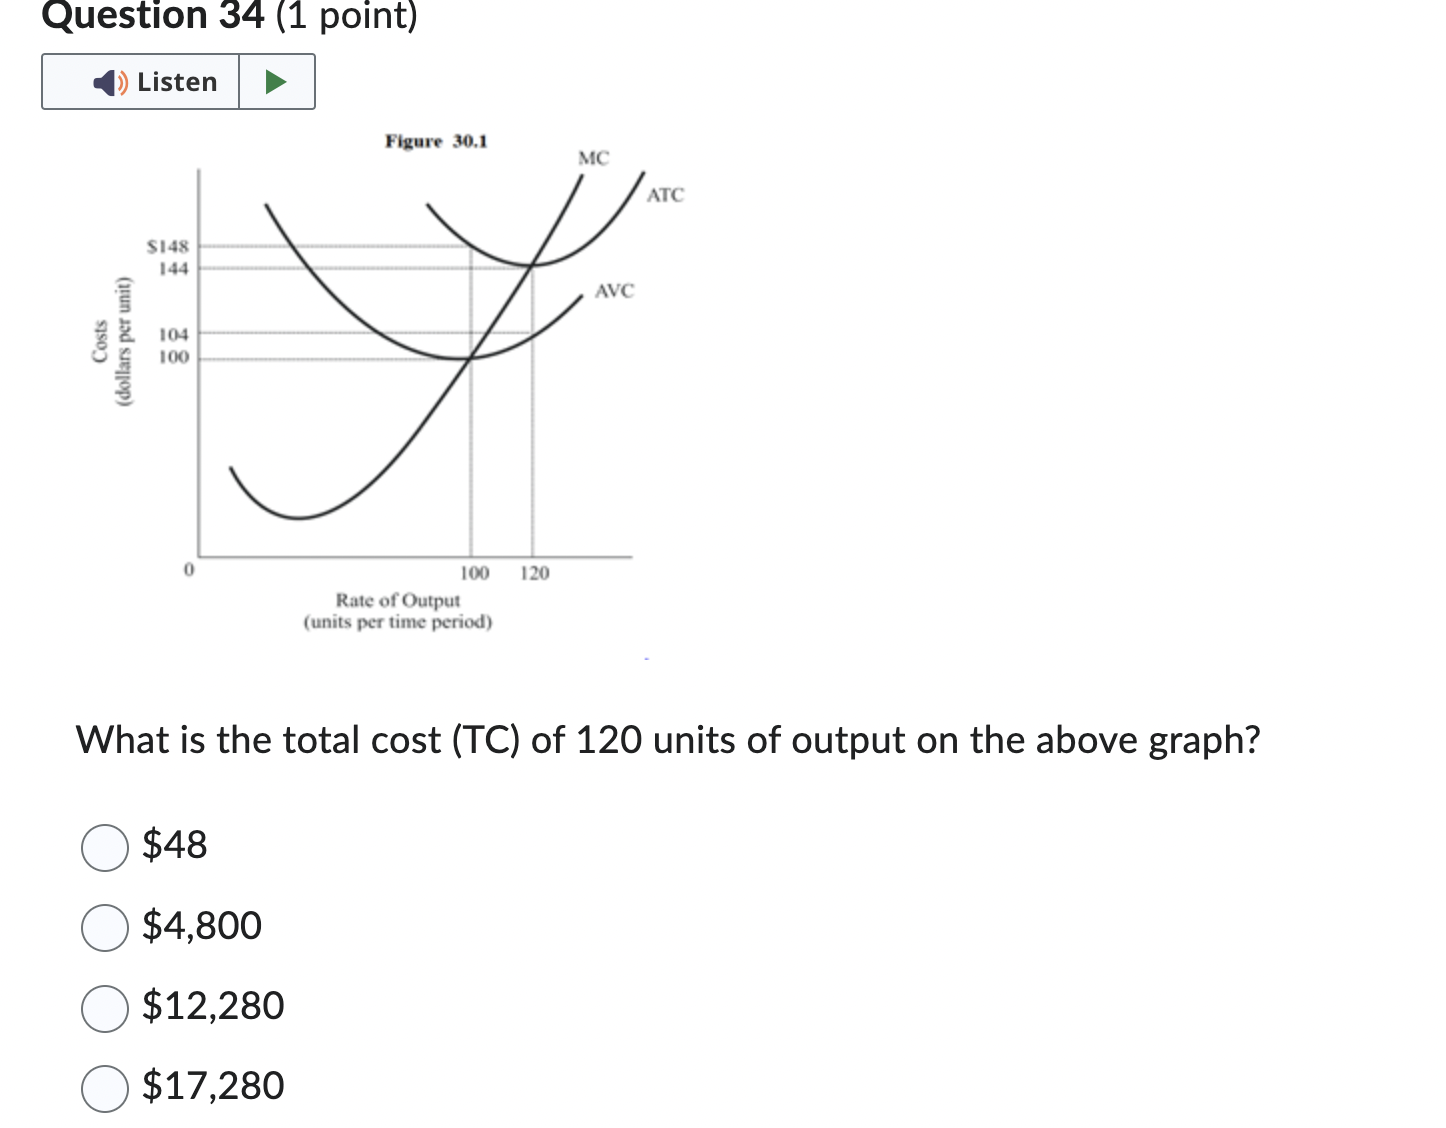
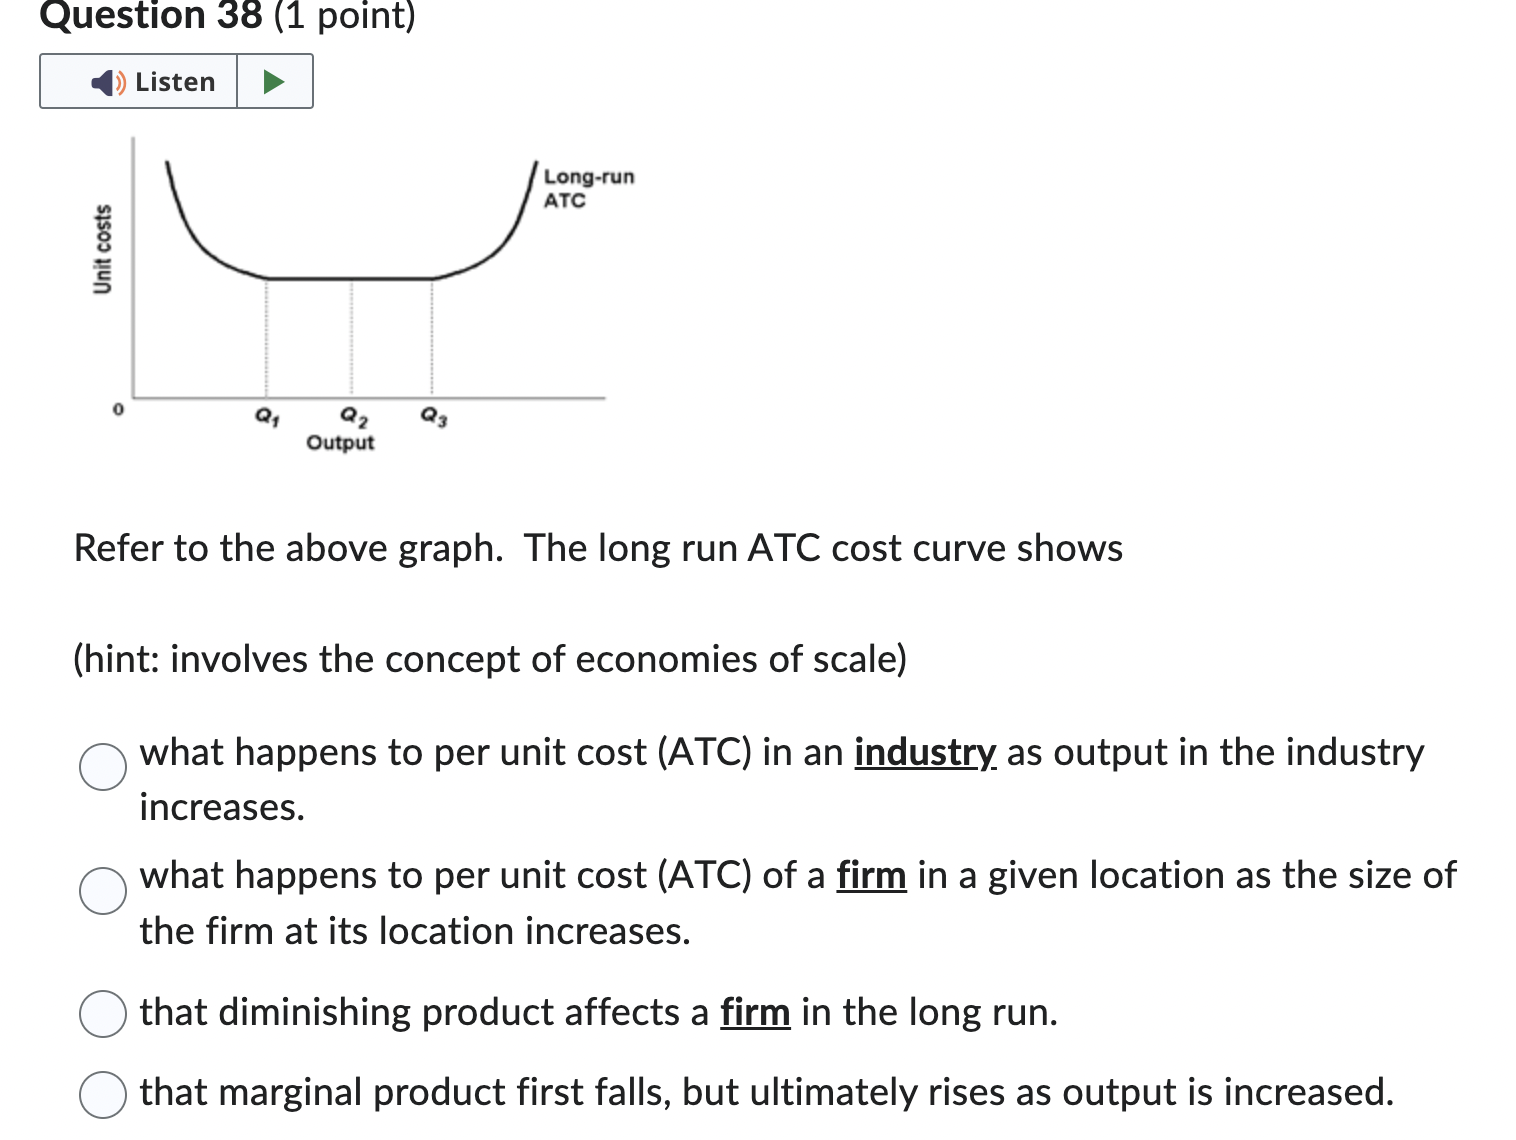
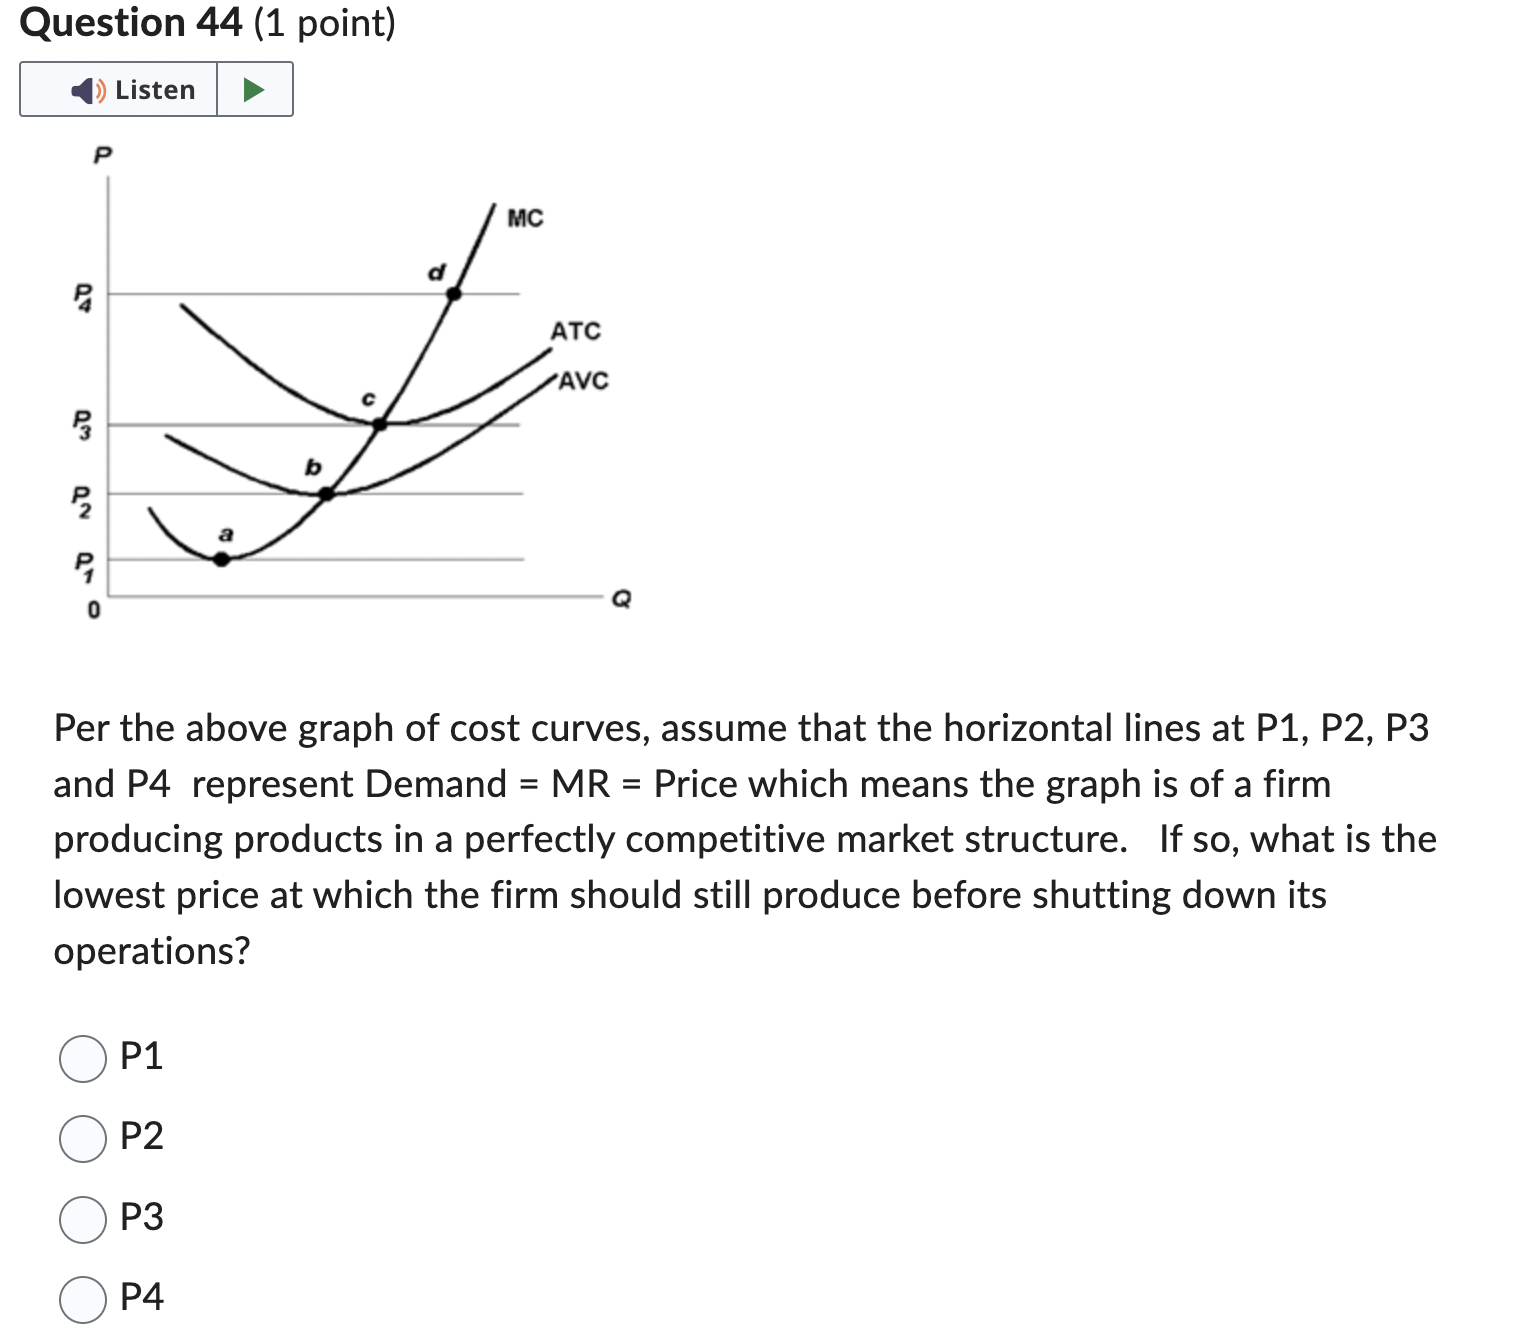
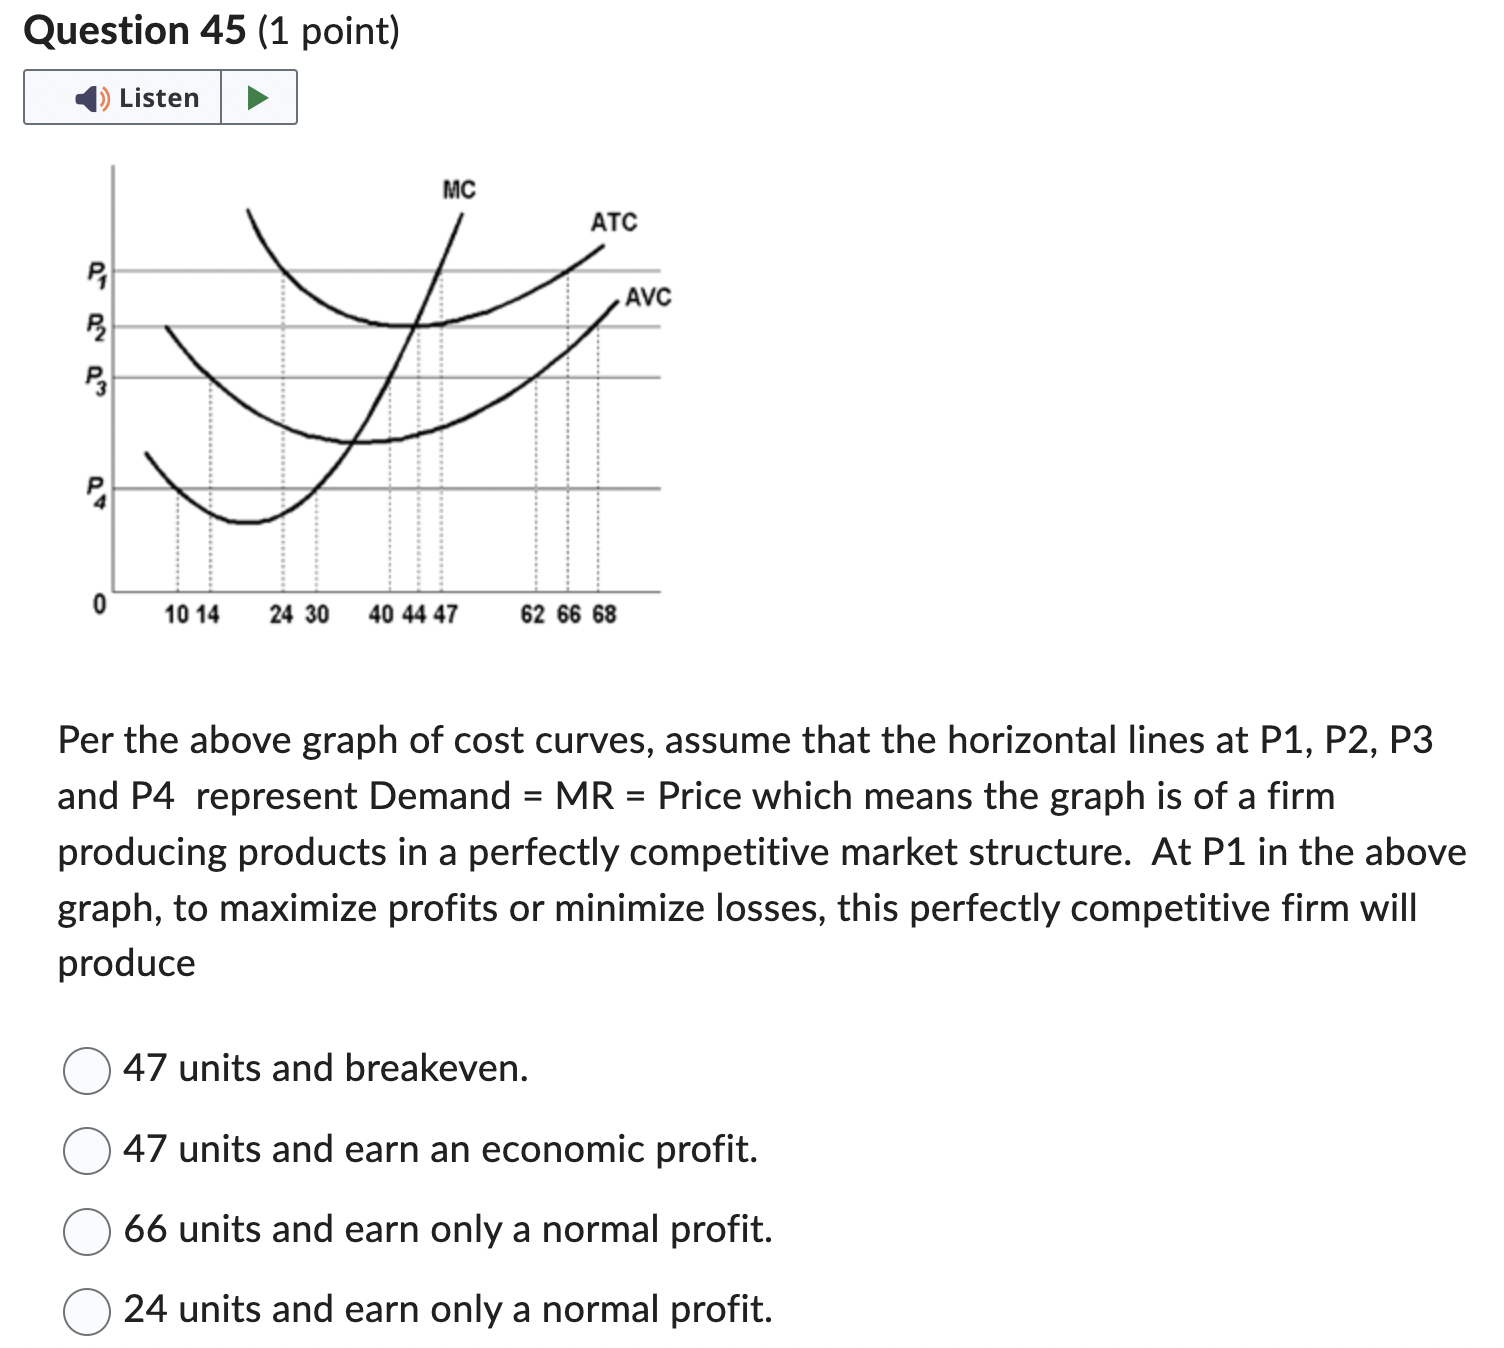
Question 31 (1 point) _II Which of the following is not an economic cost? 0 interest 0 economic profit 0 rent 0 normal profit Question 32 (1 point) I: Average costs (5) O ' Output The above graph shows a mgle firm's various short run cost curves as it expands from a plant size of #1 to #5. As it grows larger from plant size #1 to #3, it experiences 0 economies of scale 0 diseconomies of scale 0 diminishing returns 0 constant costs Question 33 (4 points) I: Suppose a firm has annual out of pocket (paid) cost of $310,000 and the owner- manager does not choose to be paid, but could receive income of $90,000 by working elsewhere. The firm further earns $420,000 per year. Accounting cost for this firm is $ ___________ , normal profit is $ ___________ , economic cost is $ ___________ and economic profit is $ ___________ . (frame your answer in this format with no $ sign as 000,000 or 00,000 as the case Question 34 (1 point) Listen Figure 30.1 MC ATC $148 144 AVC (dollars per unit) 104 Costs 100 100 120 Rate of Output (units per time period) What is the total cost (TC) of 120 units of output on the above graph? O $48 $4,800 $12,280 $17,280Question 35 (1 point) I: Which of the following is (are) true in the production of goods and services? 0 labor, land and capital resources are all variable in the short run 0 labor is the only variable resource in the short run 0 labor, land and capital resources are all variable in the long run 0 B and C above Question 36 (1 point) Listen SHORT RUN PRODUCTION FUNCTION 20 Total output 14 Output (units per day) 6 Labor Input (workers per day) Refer to the above graph. Marginal "product" for the worker hired increases compared to the previous worker hired, diminishing marginal "product" occurs with the hiring of the __ worker and negative marginal "product" is negative for the ---- _ worker hired. O 2nd, 4th, 5th 3rd, 5th, 6th O 2nd, 3rd, 6th 3rd, 4th 6thListen SHORT RUN COST CURVES $148 144 Costs (dollars per unit) 10 100 100 120 Rate of Output (units per time period) Refer to the above graph of a single firm. The "marginal cost" (MC) of the 120th unit of output is _, the "total fixed cost" (TFC) for the firm is ______ and "normal profit" is earned (true or false) at 120 units of output at a product price of $144 and above. (remember 1). at any given output ATC - AVC x the given output = TFC and 2). normal profit is a cost.) $144, $4,800, true $104, $14,800, false $104, $4,800, true $144. $4.800, falseQuestion 38 (1 point) I: Lang-run ATC Output Unit COSTS Refer to the above graph. The long run ATC cost curve shows (hint: involves the concept of economies of scale) 0 what happens to per unit cost (ATC) in an industry as output in the industry increases. what happens to per unit cost (ATC) of a firm in a given location as the size of the firm at its location increases. 0 that diminishing product affects a firm in the long run. 0 that marginal product first falls, but ultimately rises as output is increased. Question 39 (1 point) _II Lang-run ATC Output Unit 60515 Refer to the above graph. From output Q1 to Q3 there are 0 economies of scale 0 constant returns to scale 0 diminishing returns 0 diseconomies of scale. Question 40 (1 point) I: Lana-run ATC Output Un (2051': Refer to the above graph. The Long-run Average Total Cost curve (LRATC) assumes O labor is variable and land and capital are fixed 0 all resources are fixed. 0 labor is fixed and land and capital are variable. 0 labor, land and capital are all variable. Question 41 (1 point) I: In a perfectly competitive market structure, 0 a firm's demand and marginal revenue curves are the same. 0 firm's are known as "price takers" because they must accept the market price. 0 firms can earn economic profit in the short run, but only normal profit in the long run. firms maximize profits or minimize losses by producing at the output where MR = MC = Price. 0 B and D abocve. 0 all of the above. Question 42 (1 point) I: Assume the XYZ Corporation is producing 20 units of output in the short run. It is selling this output in a purely competitive market for $10 per unit. Its total fixed cost (TFC )is $100 and its average variable cost (AVC) is $3 at 20 units of output. This corporation 0 should close down in the short run 0 is maximizing its profits. O is realizing a loss of $60. 0 is realizing an economic profit of $40. Question 43 (1 point) I: p a . ATC AVC P3 . IP2 . Pf . o ' a Per the above graph of cost curves, assume that the horizontal lines at P1, P2, P3 and P4 represent Demand = MR = Price which means the graph is of a firm producing products in a perfectly competitive market structure. If so, and the product price is P3, O the firm should exit the industry O the firm will earn an economic profit. 0 the firm is at breakeven earning normal profit which is an economic cost, but not earning any economic profit. 0 new firms will enter the industry. Question 44 (1 point) I: p A11 ATC AVG % _ IP2 . P! > 0 0 Per the above graph of cost curves, assume that the horizontal lines at P1, P2, P3 and P4 represent Demand = MR = Price which means the graph is of a firm producing products in a perfectly competitive market structure. If so, what is the lowest price at which the firm should still produce before shutting down its operations? Question 45 (1 point) I: ATC AVC o 1014 2430 404447 626668 Per the above graph of cost curves, assume that the horizontal lines at P1, P2, P3 and P4 represent Demand = MR = Price which means the graph is of a firm producing products in a perfectly competitive market structure. At P1 in the above graph, to maximize profits or minimize losses, this perfectly competitive firm will produce 0 47 units and breakeven. O 47 units and earn an economic profit. O 66 units and earn only a normal profit. 0 24 units and earn only a normal profit. Question 46 (1 point) Listen Any perfectly competitive firm will always earn an economic profit when its OP = ATC OP > AVC OP = MC OP > ATCQuestion 47 (1 point) _II Firms enter a perfectly competitive industry attracted by 0 high revenues 0 normal profit 0 economic profit 0 low cost 0 lack of competition Question 48 (1 point) Listen PURE COMPETITION PROFIT ANALYSIS SHORT RUN REVENUE/COST CURVES - FIRM A Price MR A - MR 3 NO 40 - MR 2 MR 1 Q5 Quantity (note: each of the above horizontal curves (lines) represent a different demand curve for firm A. Remember that in pure competition a firm's demand curve D = P = MR) Refer to the above graph. Firm A will realize an economic profit if it produces at revenue (MR) are O Q1 O Q2 O Q3 O Q4Question 49 (1 point) Listen PURE COMPETITION PROFIT ANALYSIS SHORT RUN REVENUE/COST CURVES - FIRM A Price MR A - MR 3 NO MR 2 MR Quantity (note: each of the above horizontal curves (lines) represent a different demand curve for firm A. Remember that in pure competition a firm's demand curve D = P = MR) Refer to the above graph. Firm A will realize a loss if it produces at O Q1. O Q2. O Q3. O Q4. A and B above.Question 50 (1 point) Listen To maximize profits or minimize losses, a perfectly competitive firm should produce the level of output where MR = ATC MR = MC = P MR = AVC O none of the aboveQuestion 51 (1 point) I: For a perfectly competitive firm, the ATC curve is used to determine if the firm is earning an economic profit, normal profit, operating at breakeven or experiencing a loss
Step by Step Solution
There are 3 Steps involved in it
Step: 1
Get Instant Access to Expert-Tailored Solutions
See step-by-step solutions with expert insights and AI powered tools for academic success
Step: 2
Step: 3
Ace Your Homework with AI
Get the answers you need in no time with our AI-driven, step-by-step assistance