thank you!
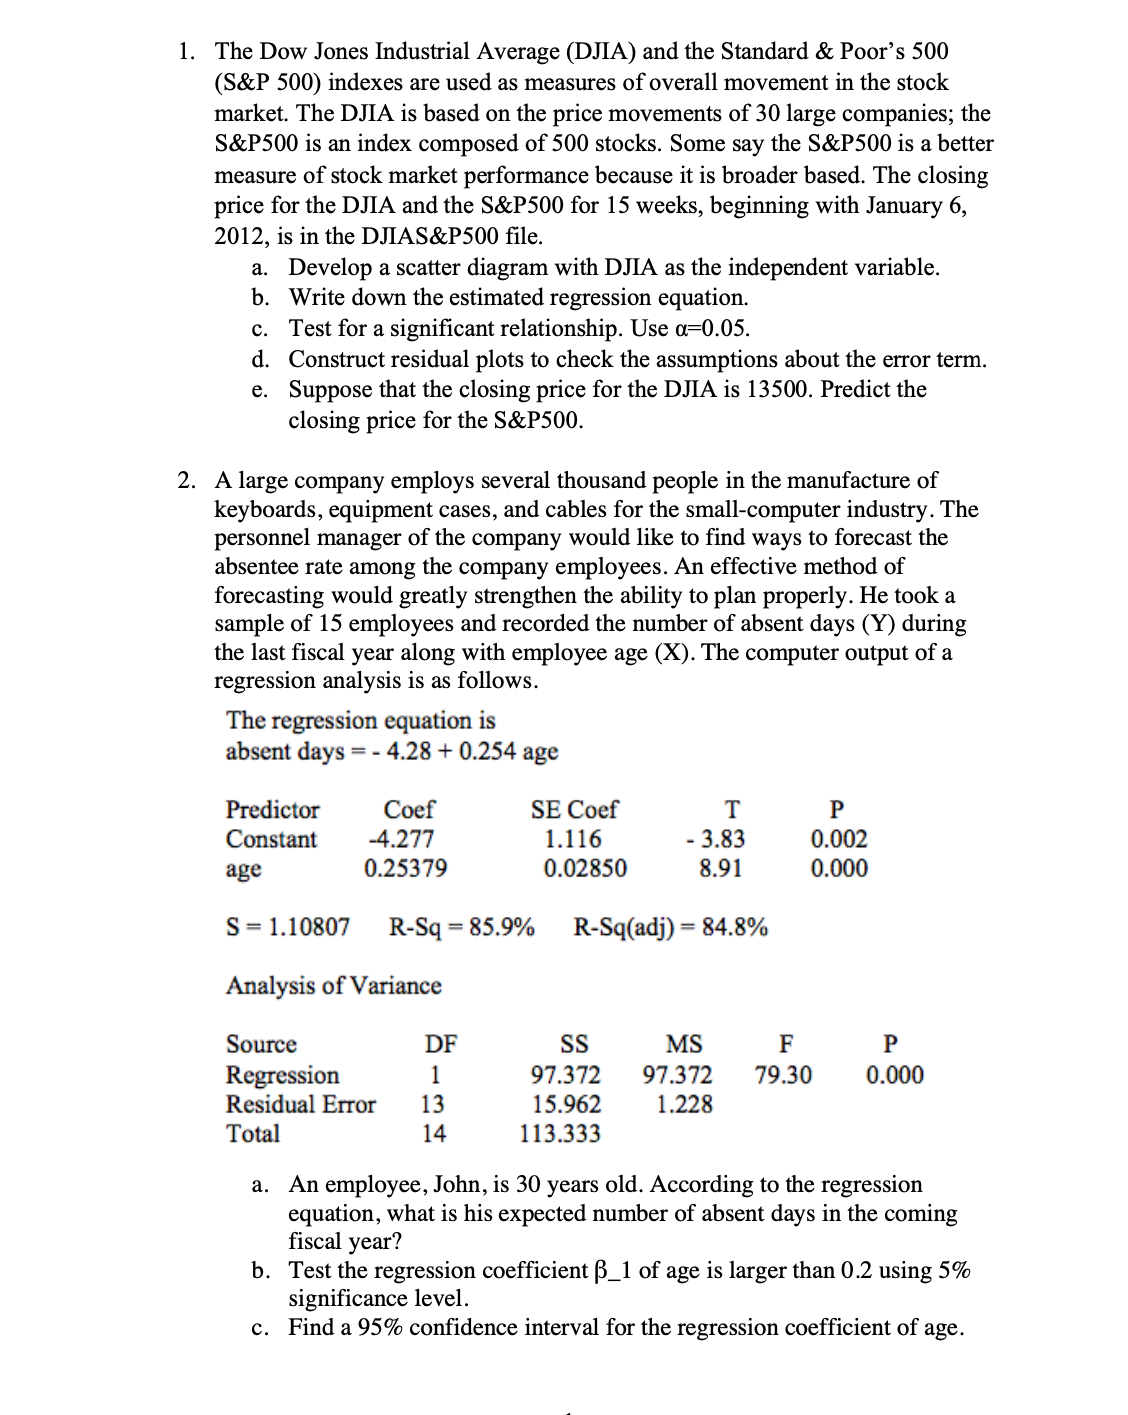
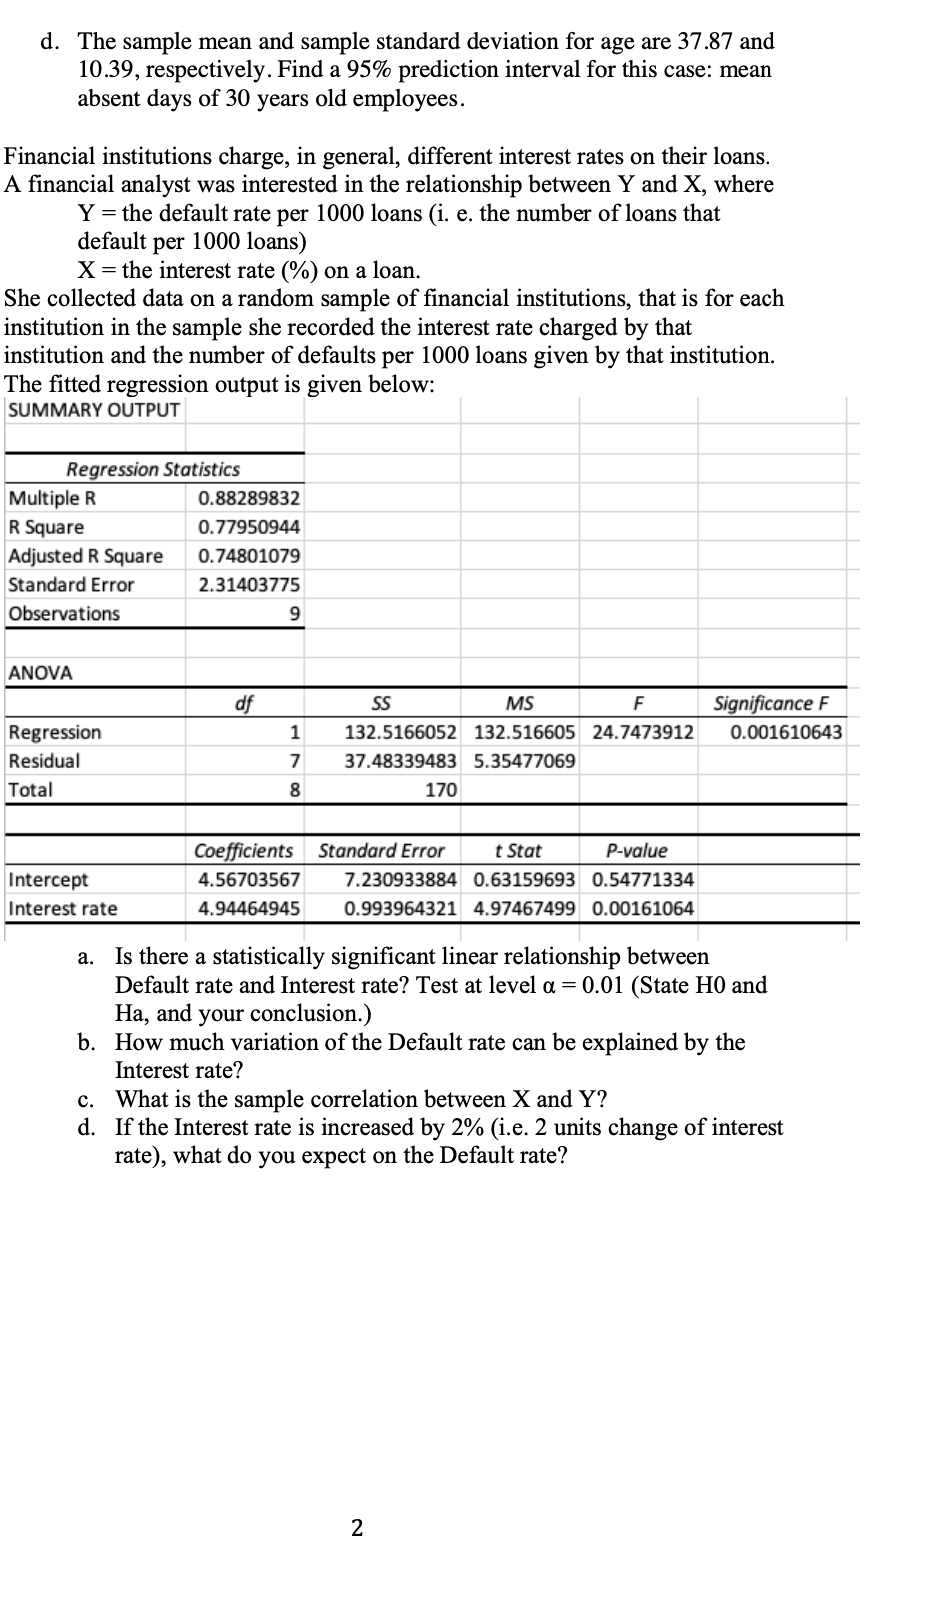
l. The Dow Jones Industrial Average (DJIA) and the Standard & Poor's 500 (S&P 500) indexes are used as measures of overall movement in the stock market. The DJIA is based on the price movements of 30 large companies; the S&P5 00 is an index composed of 500 stocks. Some say the S&P5 00 is a better measure of stock market performance because it is broader based. The closing price for the DJIA and the S&P500 for 15 weeks, beginning with January 6, 2012, is in the DJIAS&P500 le. Develop a scatter diagram with DJIA as the independent variable. Write down the estimated regression equation Test for a signicant relationship. Use ot=0.05. Construct residual plots to check the assumptions about the error term. Suppose that the closing price for the DJIA is 13500. Predict the closing price for the S&P5 00. 9999's A large company employs several thousand people in the manufacture of keyboards, equipment cases, and cables for the smallcomputer industry. The personnel manager of the company would like to find ways to forecast the absentee rate among the company employees. An effective method of forecasting would greatly strengthen the ability to plan properly. He took a sample of 15 employees and recorded the number of absent days (Y) during the last fiscal year along with employee age (X). The computer output of a regression analysis is as follows. The regression equation is absent days = - 428 + 0.254 age Predictor Coef SE Coef T P Constant 4.277 1.116 - 3.83 0.002 age 0.25379 0.02850 8.91 0.000 s = 1.10807 R-Sq = 35.9% R-Sq(adj) = 84.8% Analysis of Variance Source DF SS MS F P Regression 1 97.372 97.372 79.30 0.000 Residual Error 13 15.962 1.228 Total 14 1 13.333 a. An employee, John, is 30 years old. According to the regression equation, what is his expected number of absent days in the coming fiscal year? b. Test the regression coefcient B_1 of age is larger than 0.2 using 5% significance level. c. Find a 95% condence interval for the regression coefficient of age. d. The sample mean and sample standard deviation for age are 37.87 and 10.39, respectively. Find a 95% prediction interval for this case: mean absent days of 30 years old employees. Financial institutions charge, in general, different interest rates on their loans A financial analyst was interested in the relationship between Y and X, where Y = the default rate per 1000 loans (i. e. the number of loans that default per 1000 loans) X = the interest rate (%) on a loan. She collected data on a random sample of financial institutions, that is for each institution in the sample she recorded the interest rate charged by that institution and the number of defaults per 1000 loans given by that institution. The fitted regression output is given below: SUMMARY OUTPUT Regression Statistics Multiple R 0.88289832 R Square 0.77950944 Adjusted R Square 0.74801079 Standard Error 2.31403775 Observations 9 ANOVA df SS MS F Significance F Regression 1 132.5166052 132.516605 24.7473912 0.001610643 Residual 37.48339483 5.35477069 Total 170 Coefficients Standard Error t Stat P-value Intercept 4.56703567 7.230933884 0.63159693 0.54771334 Interest rate 4.94464945 0.993964321 4.97467499 0.00161064 a. Is there a statistically significant linear relationship between Default rate and Interest rate? Test at level a = 0.01 (State HO and Ha, and your conclusion.) b. How much variation of the Default rate can be explained by the Interest rate? c. What is the sample correlation between X and Y? d. If the Interest rate is increased by 2% (i.e. 2 units change of interest rate), what do you expect on the Default rate? 2


