thanks and please show work as I'm
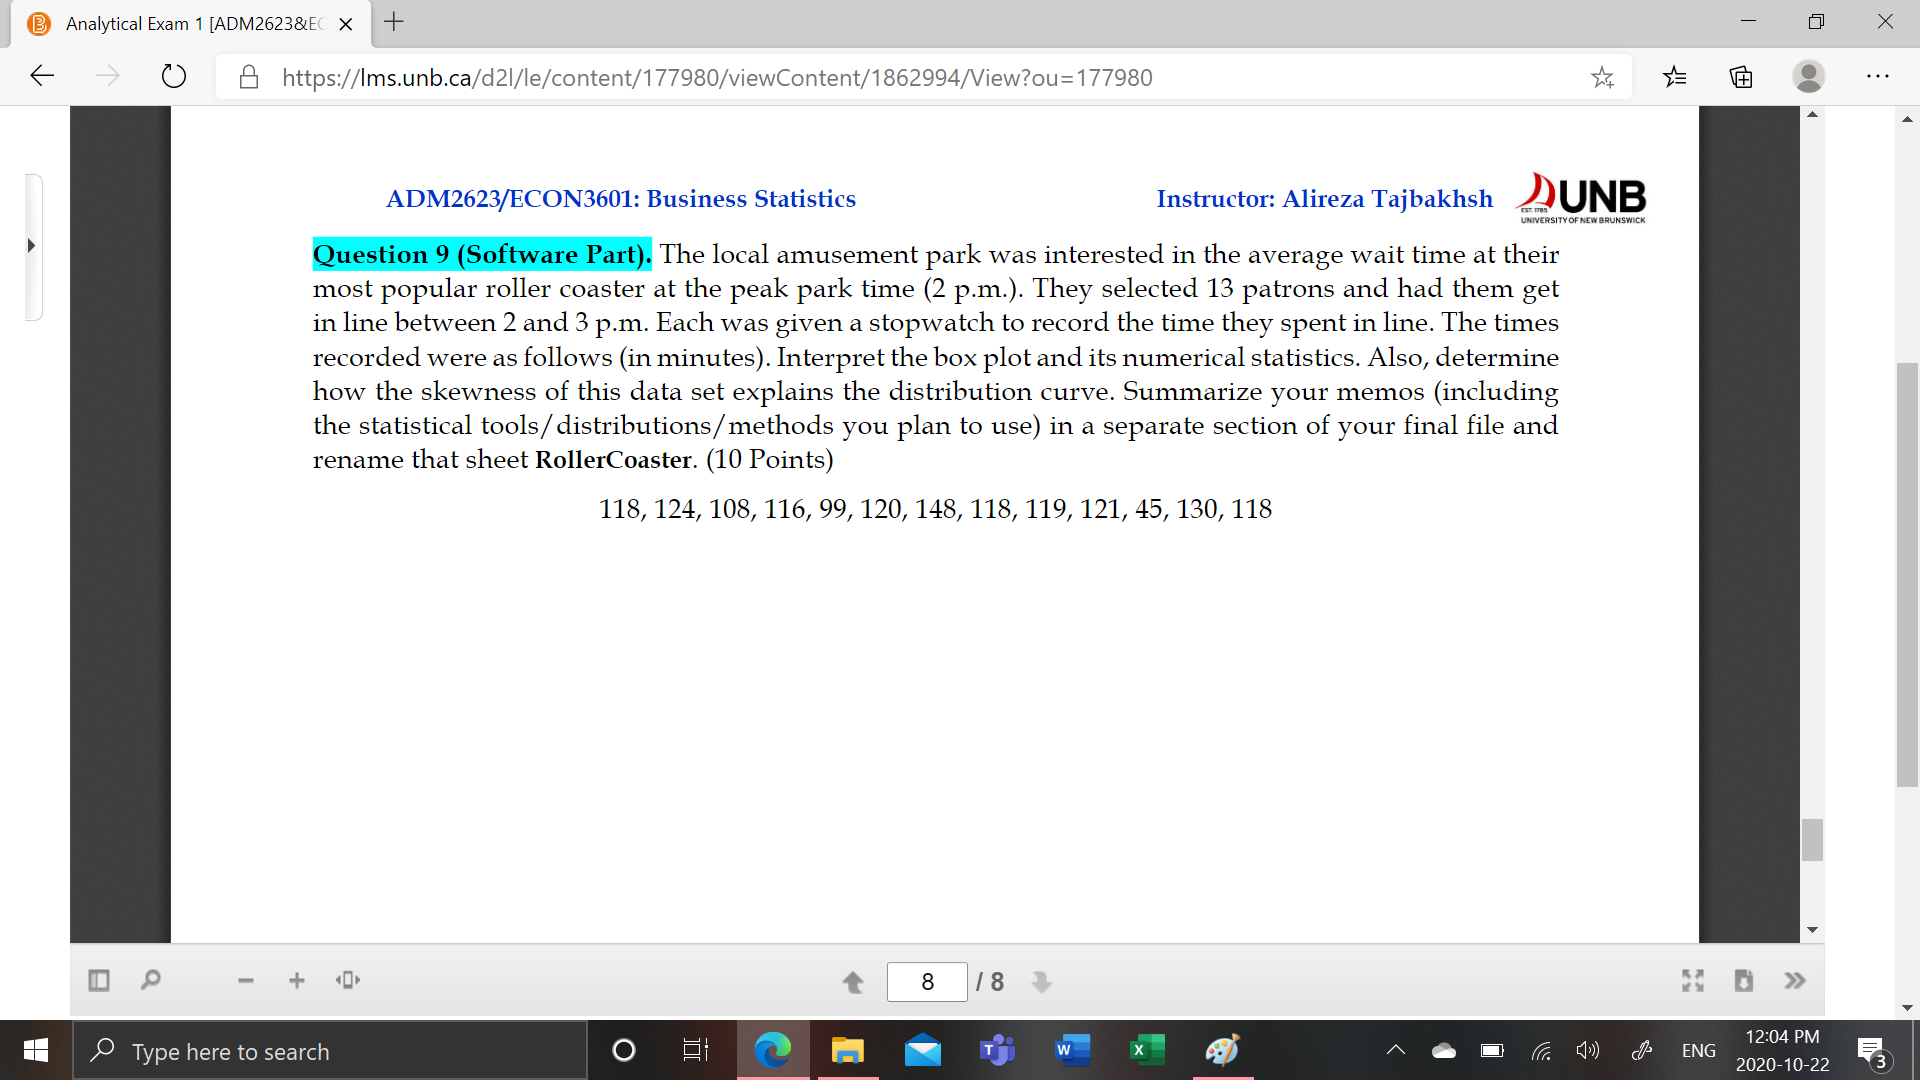
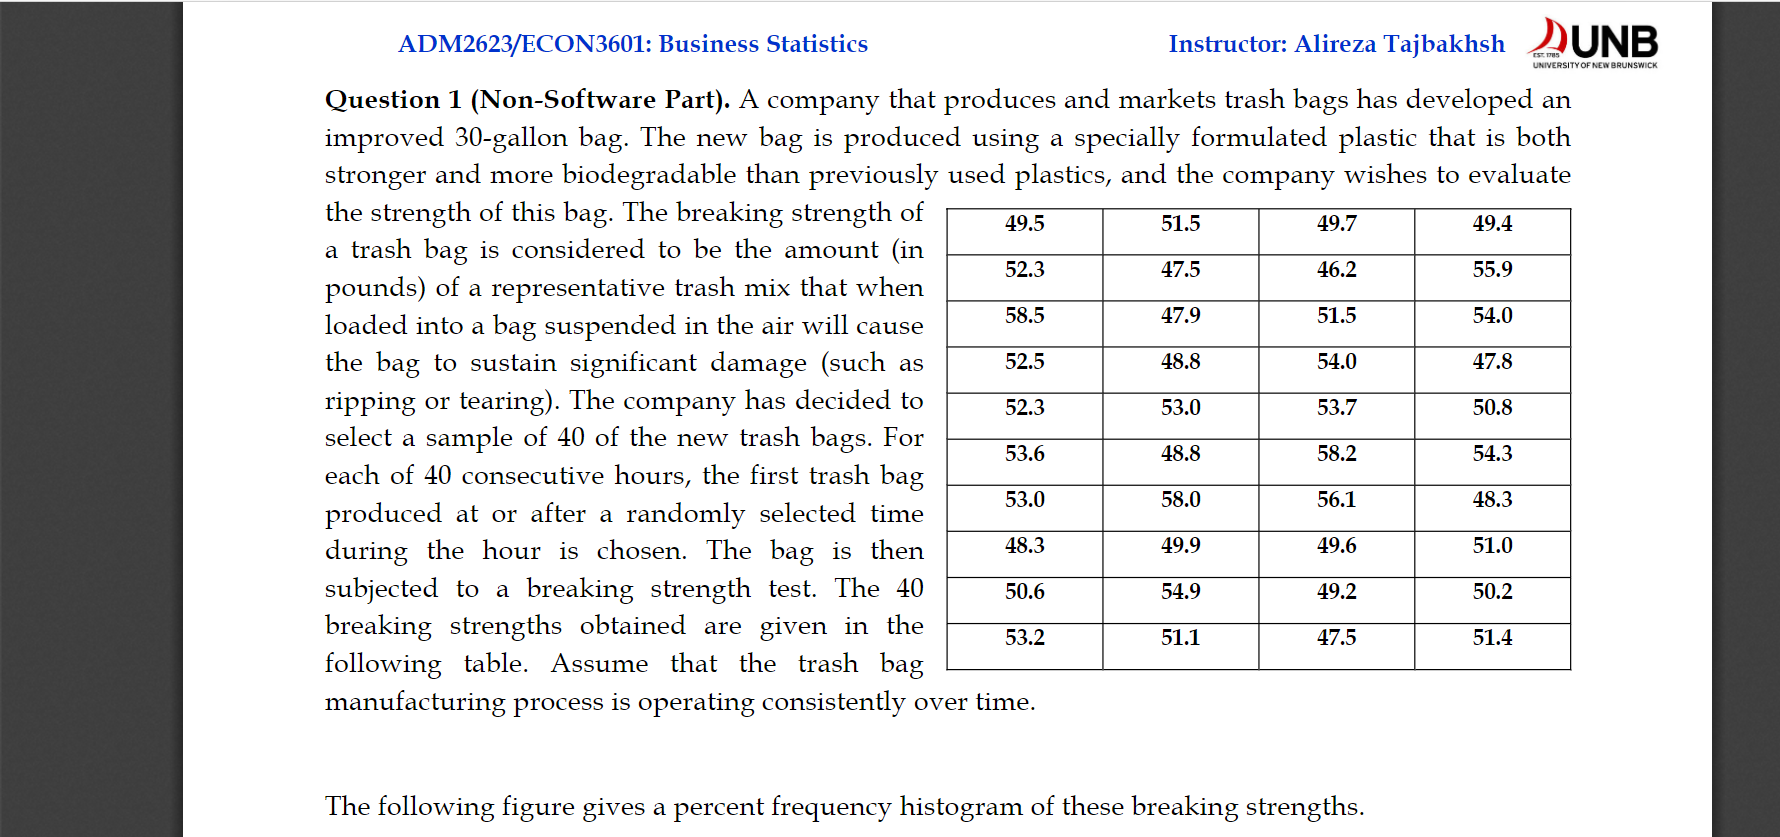
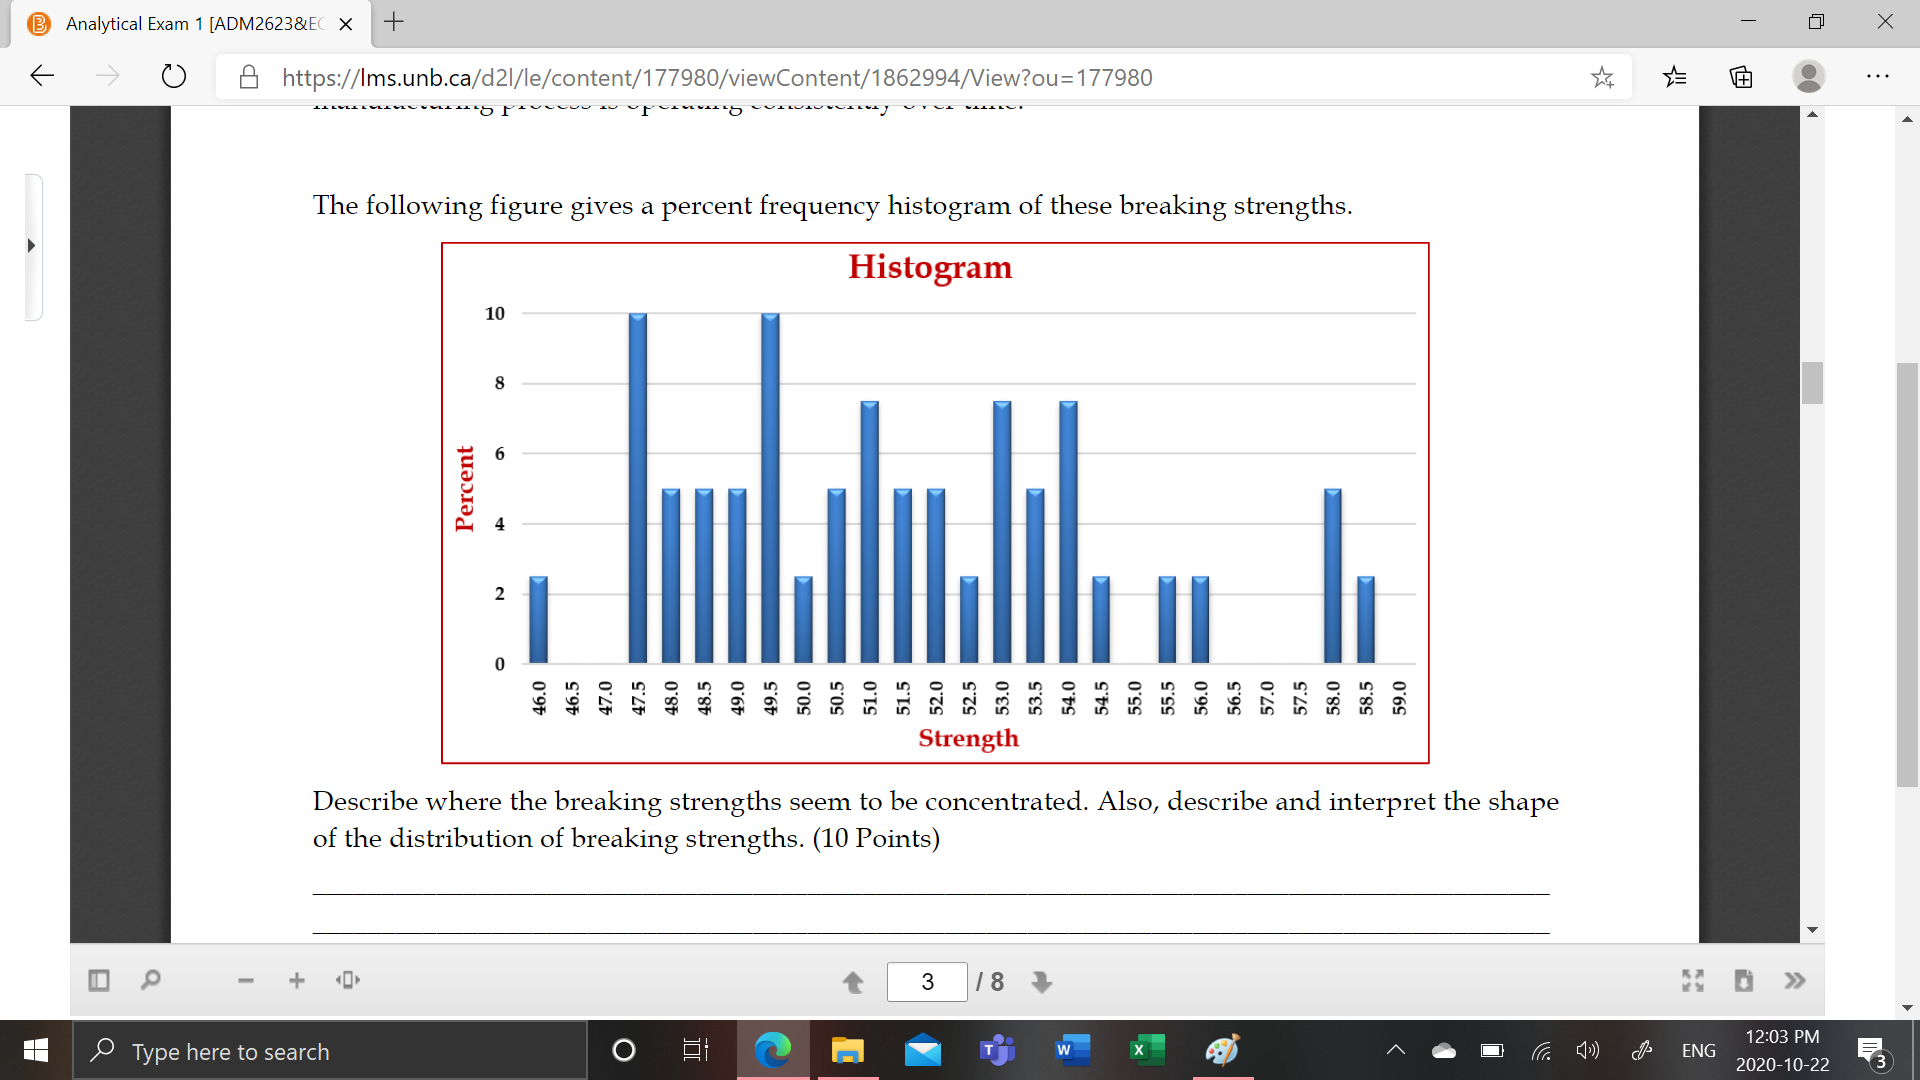
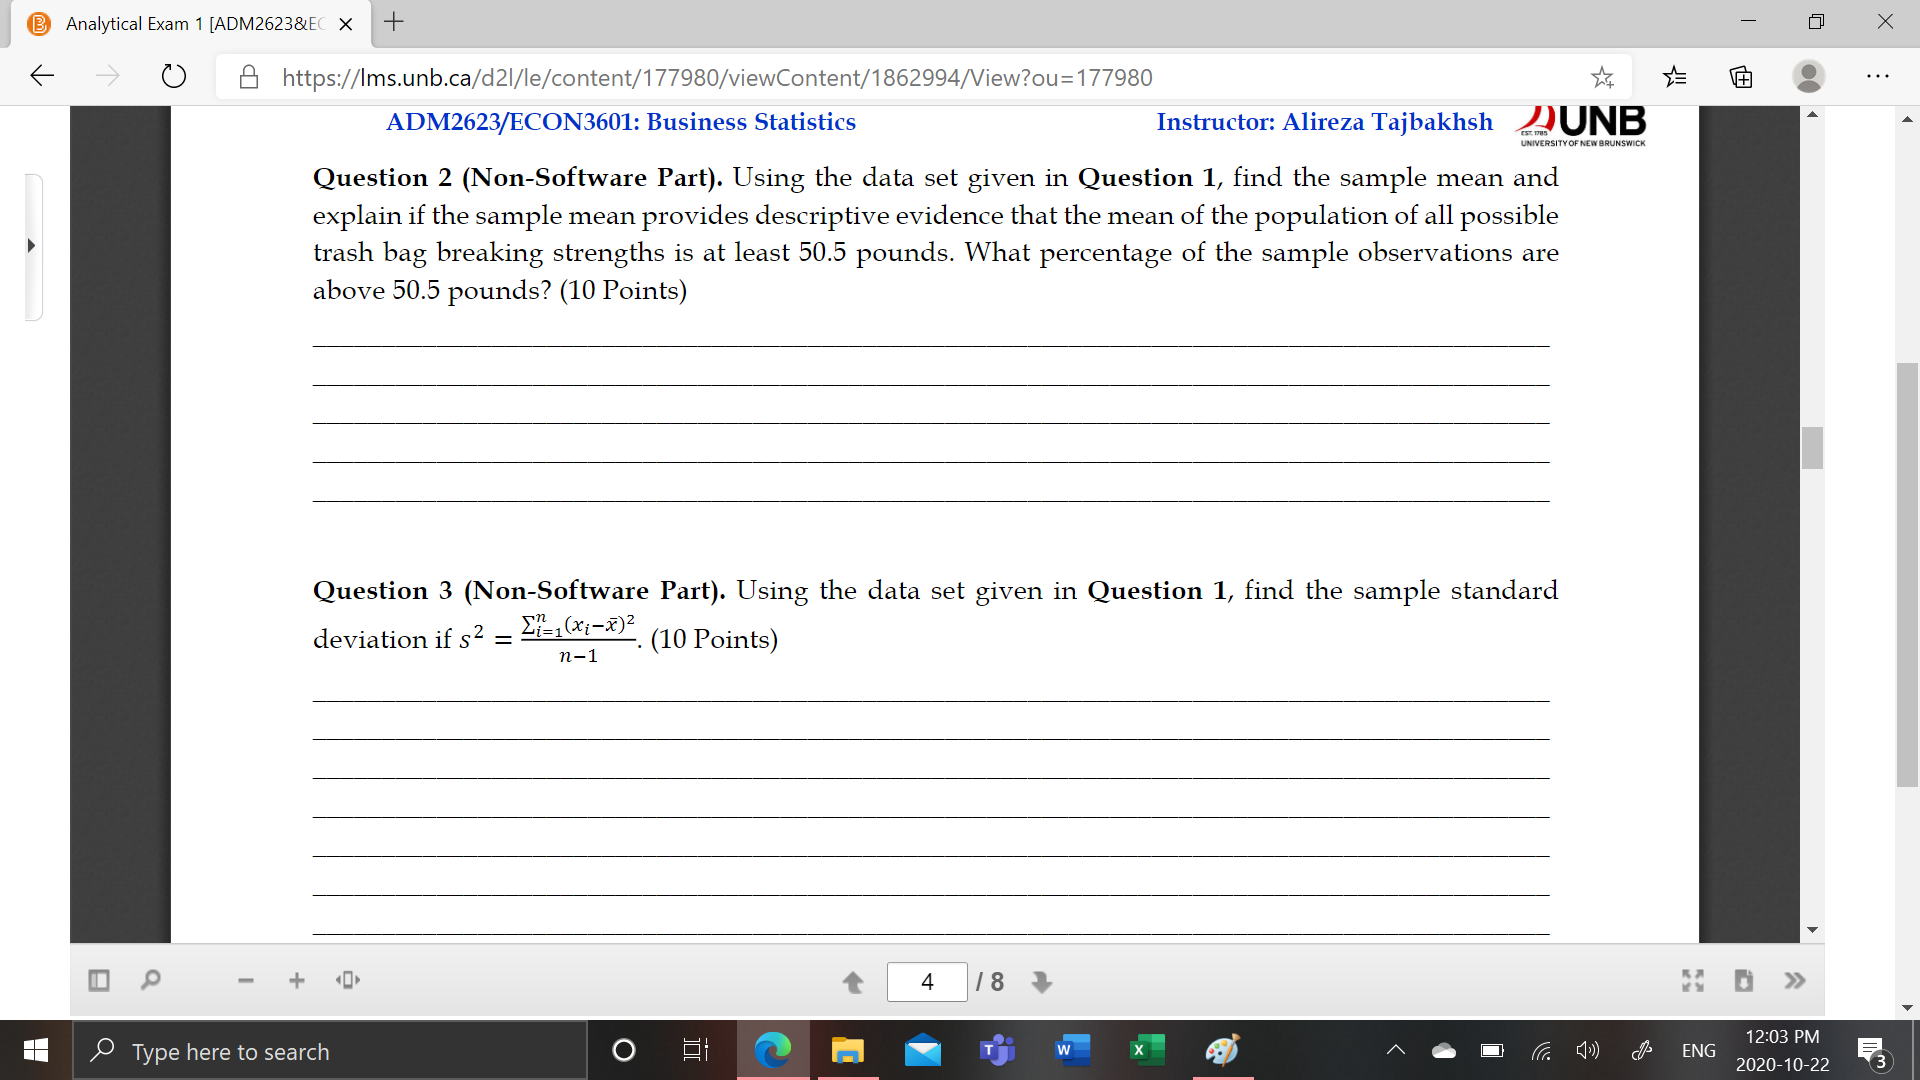
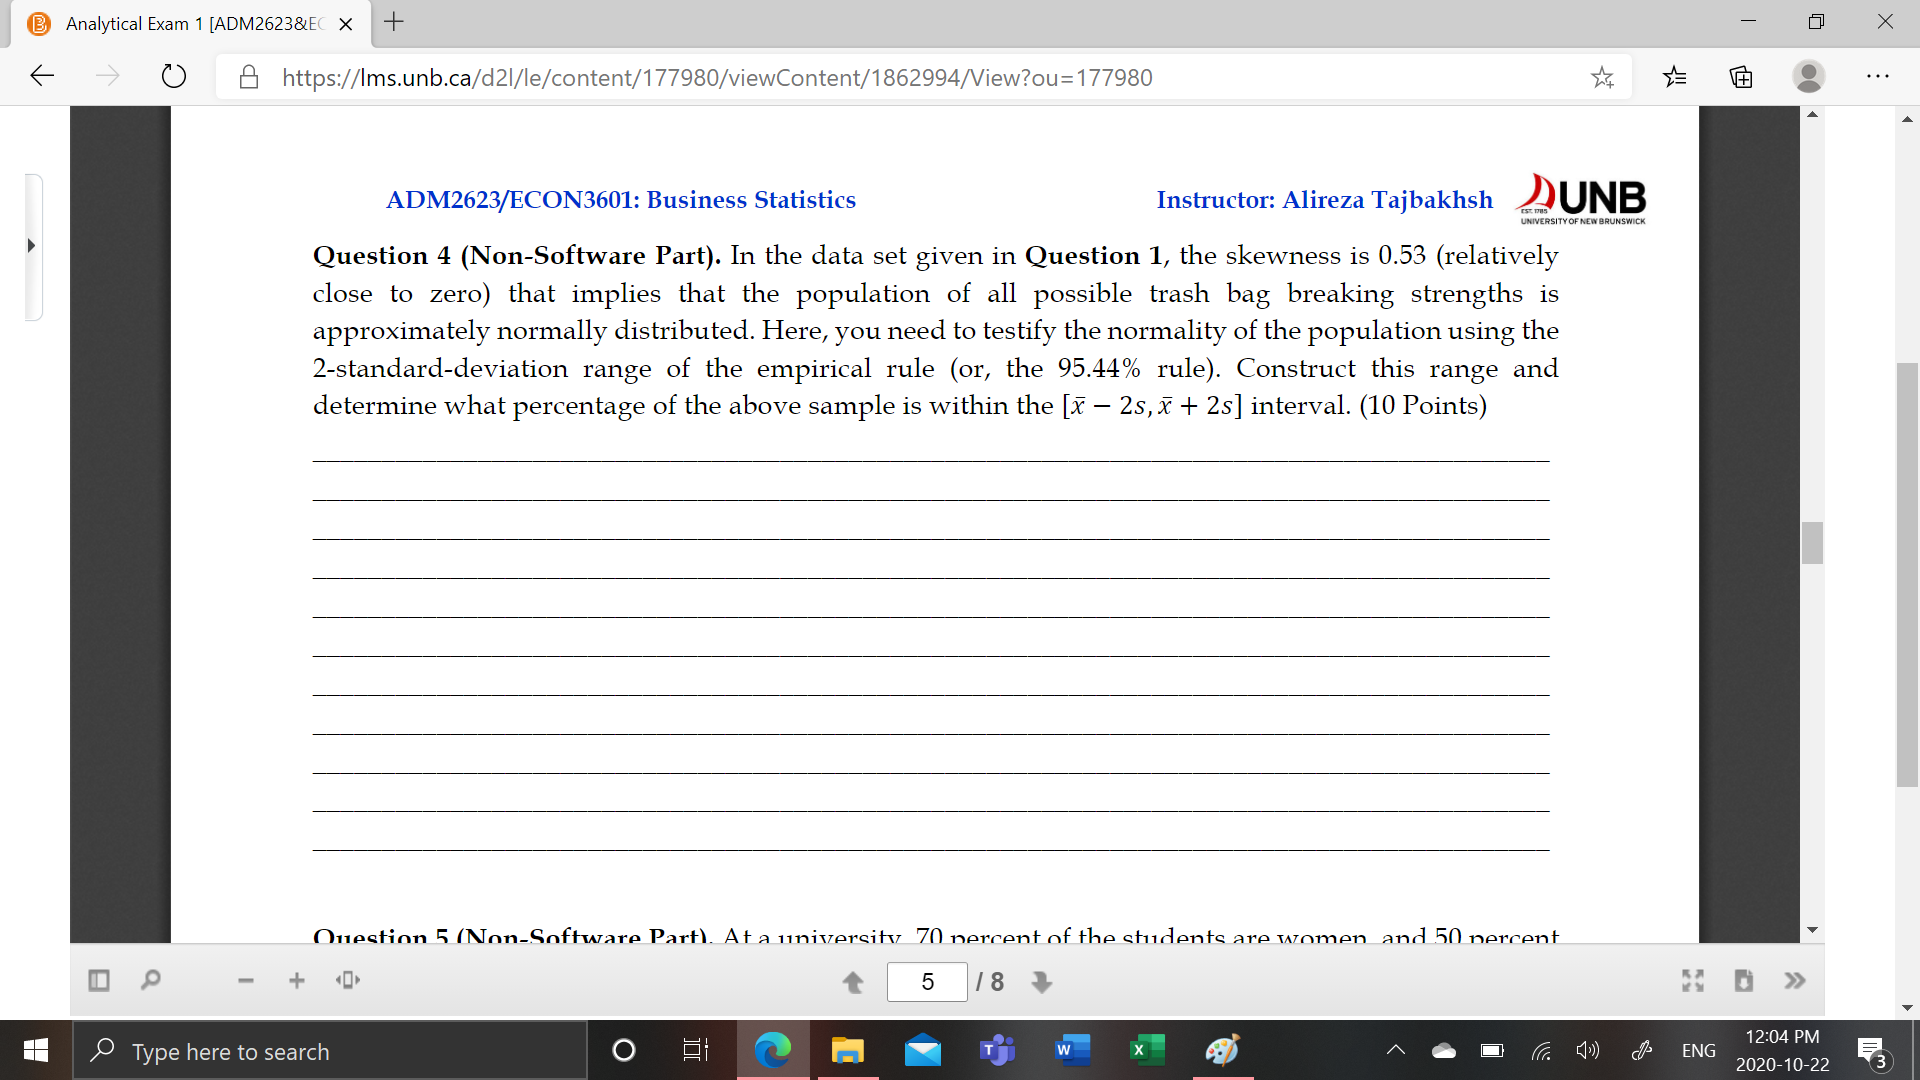
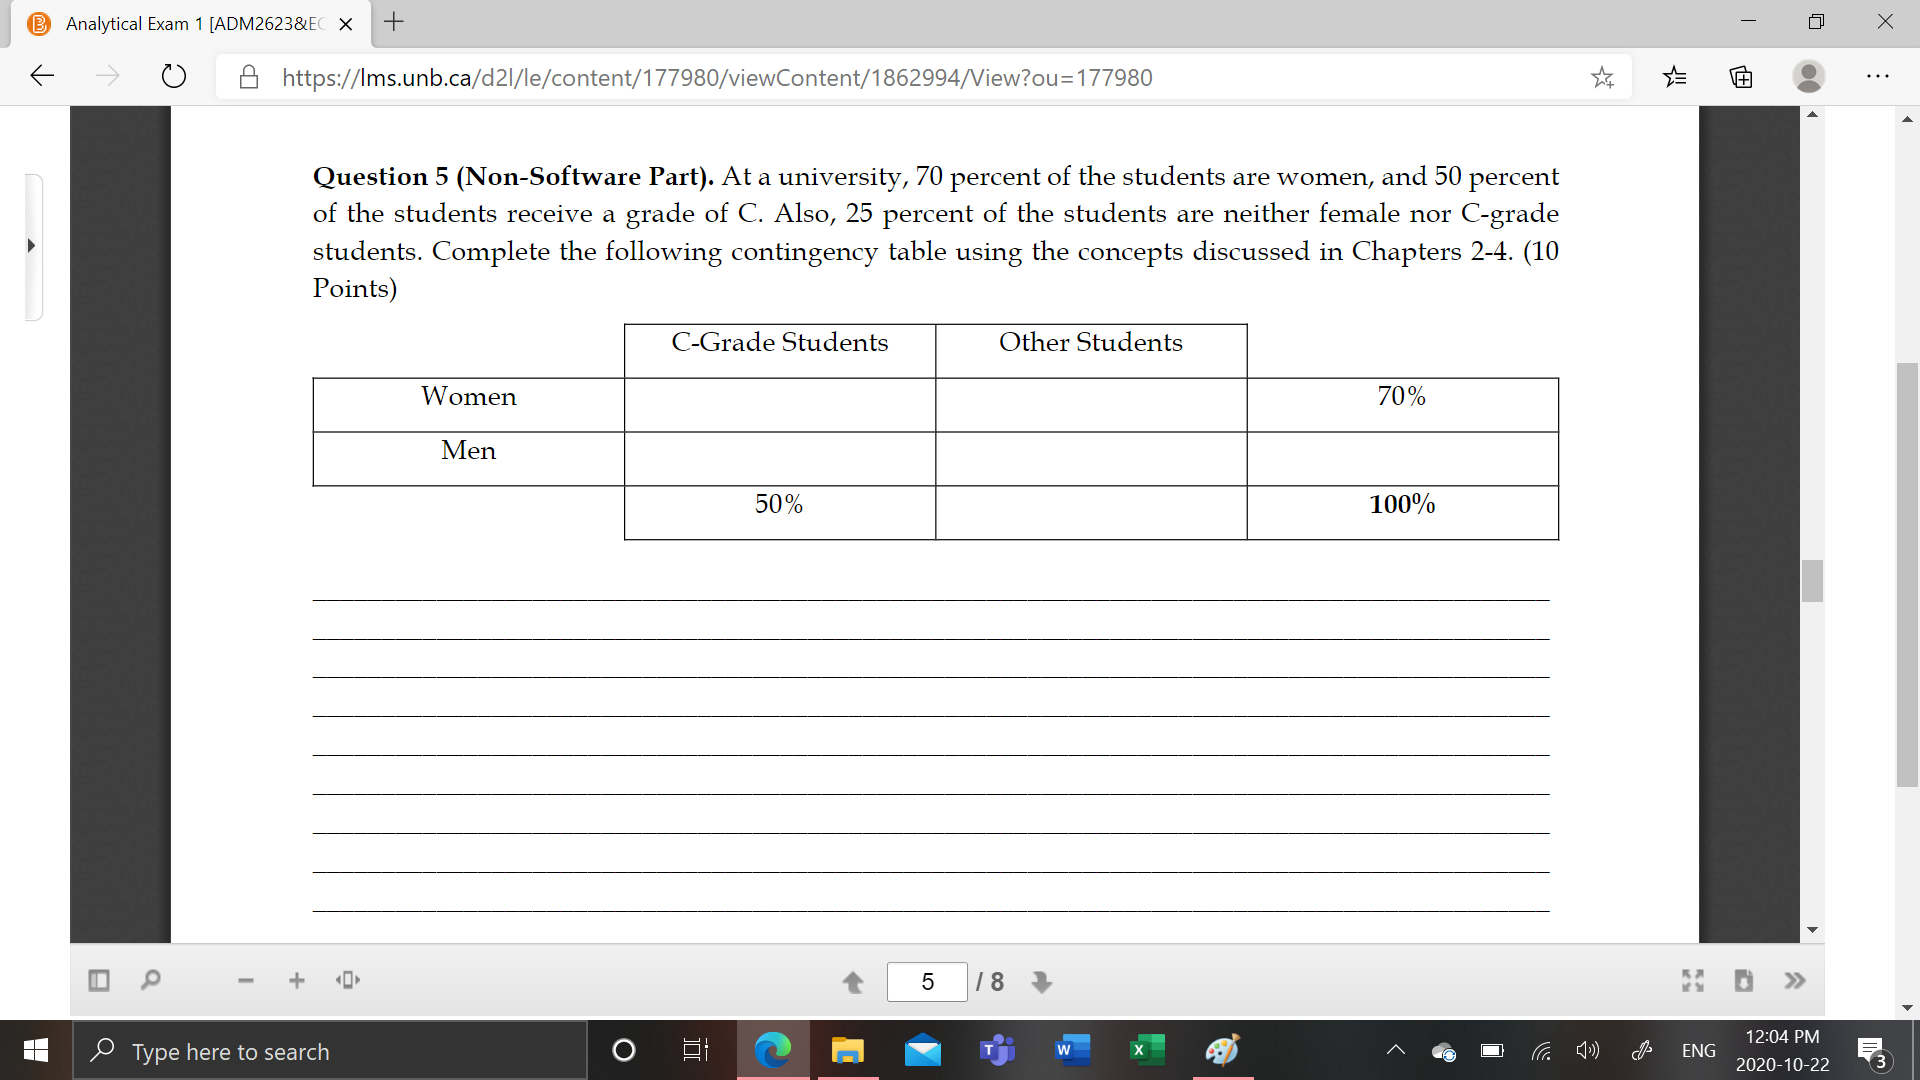
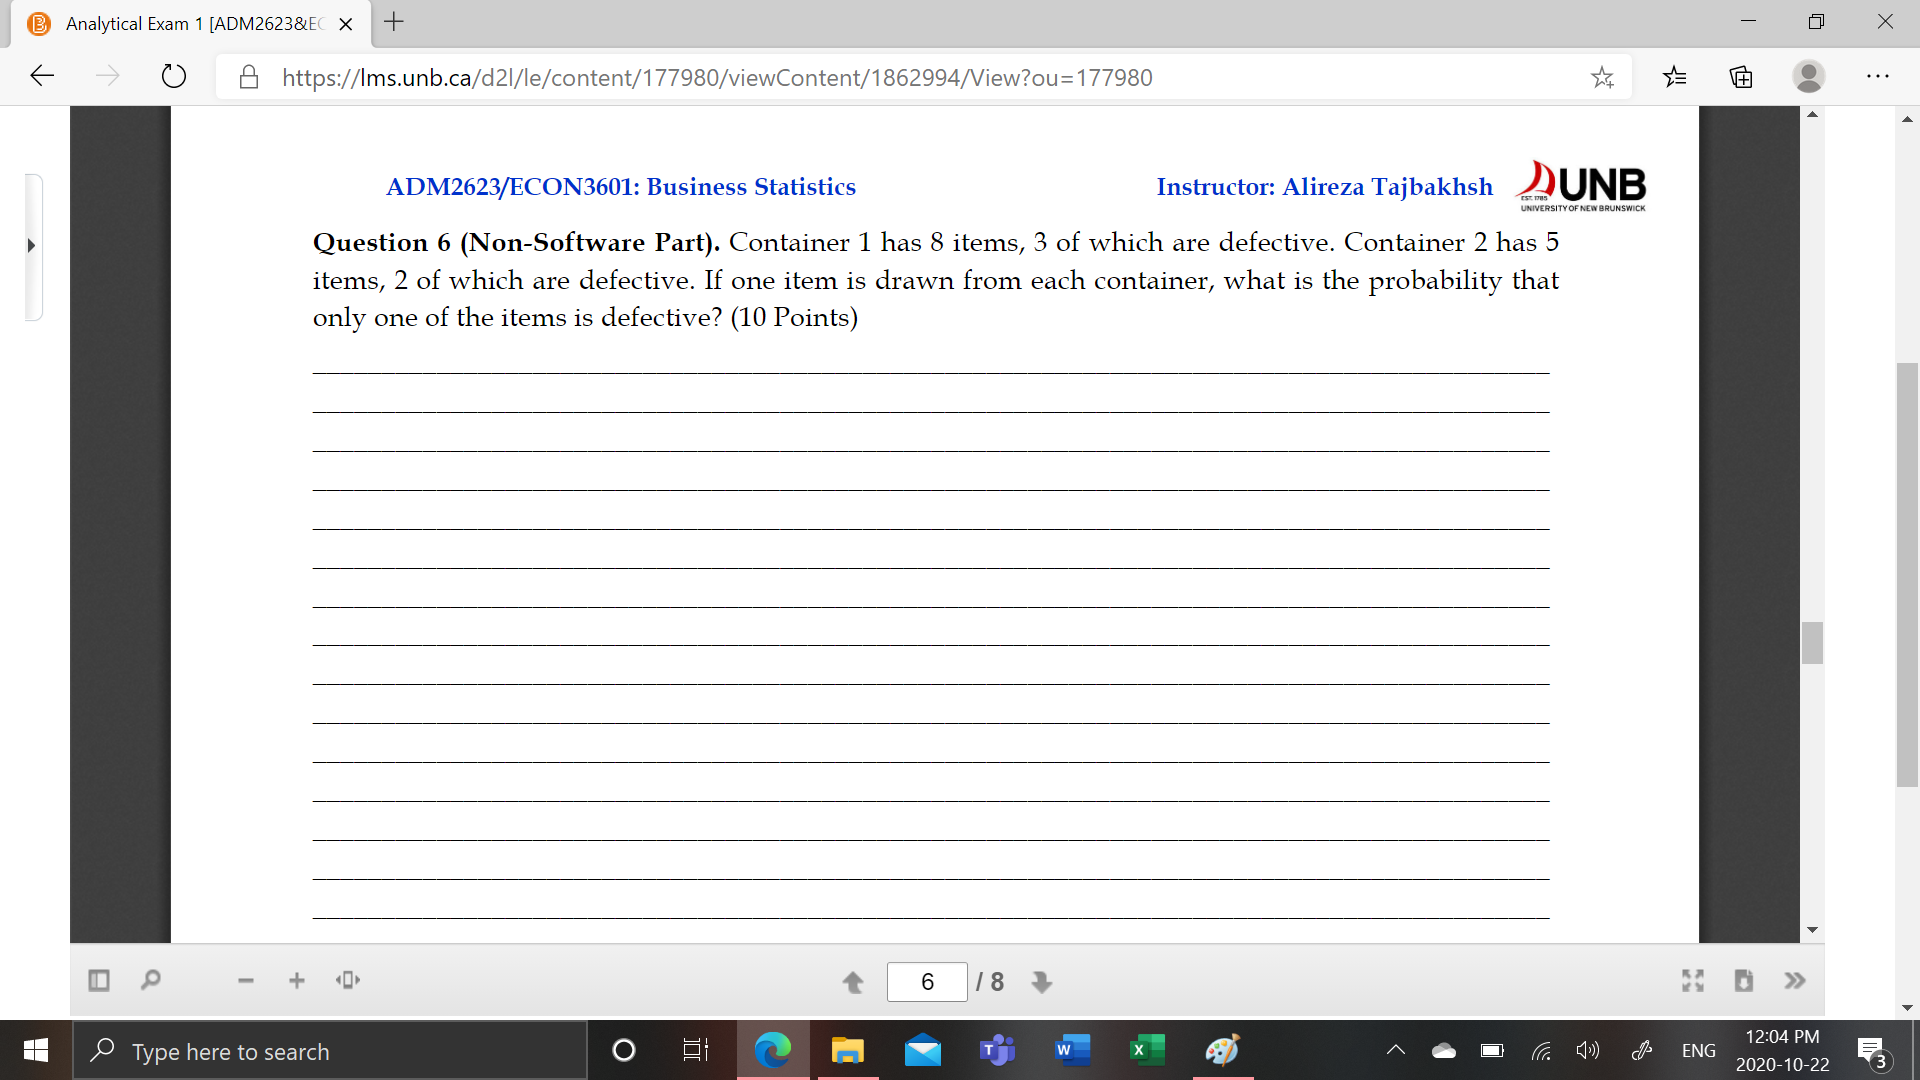
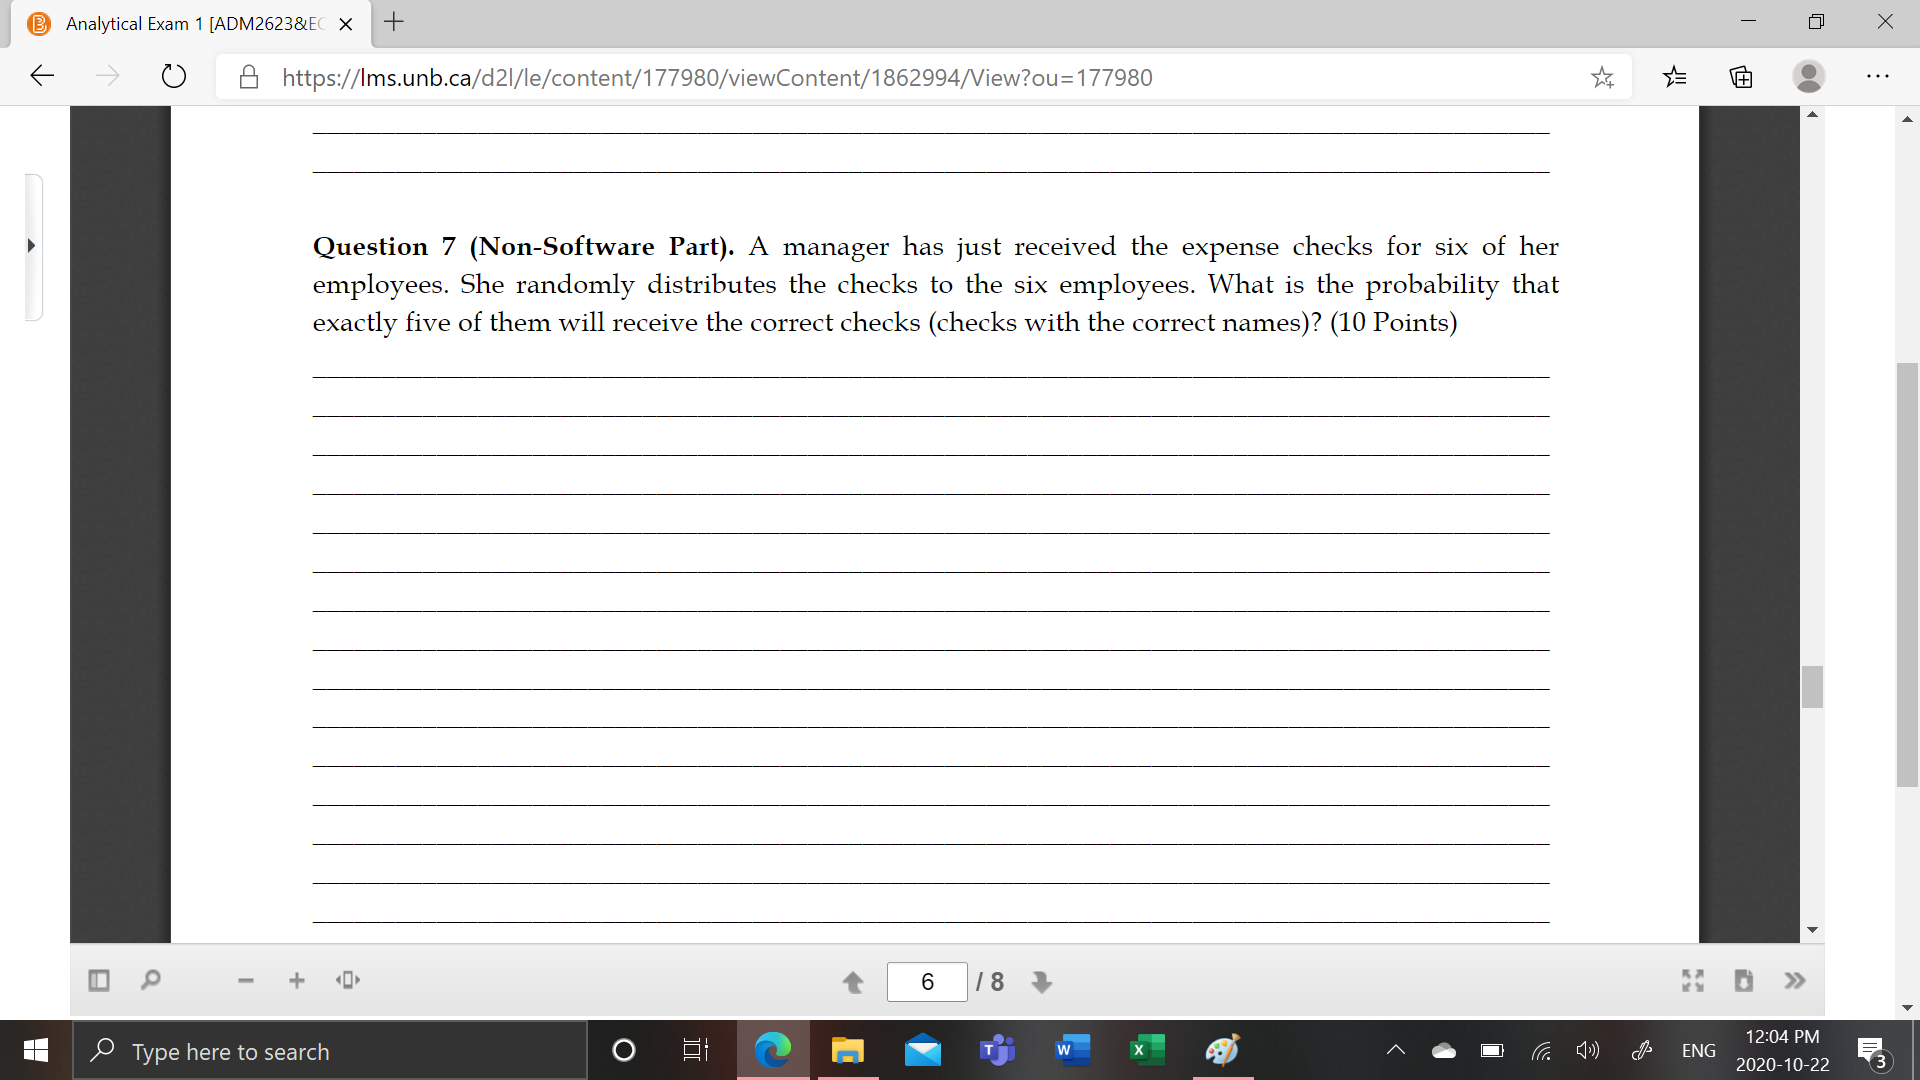
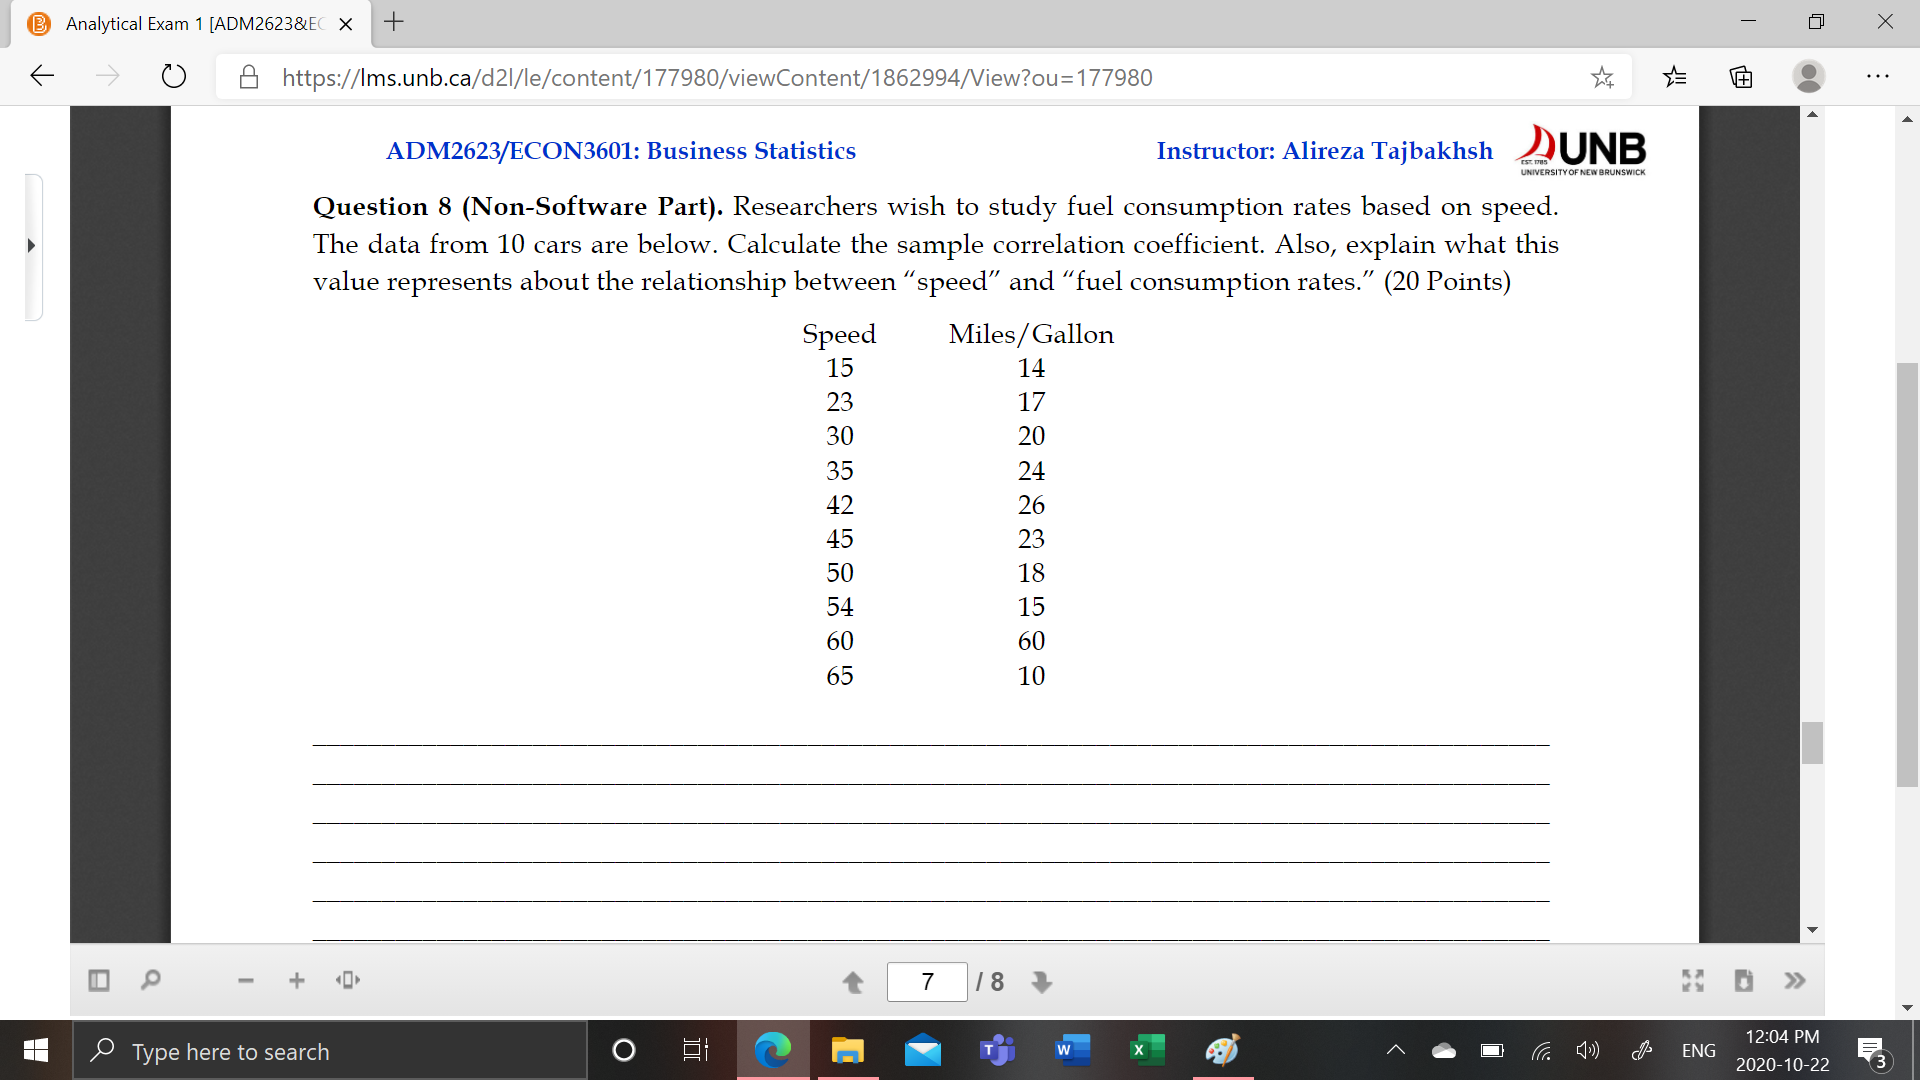
' Analytical Exam 1 [ADM262381EL x l + 7 X 6 O E. https://|ms.unb.ca/d2l/Ie/content/177980/viewContent/1862994/View?ou=177980 it 75's E: g ADM2623/ECON3601: Business Statistics Instructor: Alireza Tajbakhsh J\") UNB ' Question 9 (Software Part). The local amusement park was interested in the average wait time at their most popular roller coaster at the peak park time (2 pm) They selected 13 patrons and had them get in line between 2 and 3 pimi Each was given a stopwatch to record the time they spent in line The times recorded were as follows (in minutes). Interpret the box plot and its numerical statistics Also, determine how the skewness of this data set explains the distribution curve. Summarize your memos (including the statistical tools/ distributions / methods you plan to use) in a separate section of your final file and rename that sheet RollerCoaster, (10 Points) 118, 124, 108, 116, 99, 120, 148, 118, 119, 121, 45, 130, 118 12:04 PM 53 2020710722 ADM2623/ECON3601: Business Statistics Instructor: Alireza Tajbakhsh QUNB Question 1 (Non-Software Part). A company that produces and markets trash bags has developed an improved 30-gallon bag. The new bag is produced using a specially formulated plastic that is both stronger and more biodegradable than previously used plastics, and the company wishes to evaluate the strength of this bag. The breaking strength of 49.5 51.5 49.7 49.4 a trash bag is considered to be the amount (in _ _ 52.3 47.5 46.2 55.9 pounds) of a representative trash mix that when loaded into a bag suspended in the air will cause 58'5 473 51.5 54'0 the bag to sustain significant damage (such as 52-5 48.8 54.0 47.8 ripping or tearing). The company has decided to 52_3 531] 53.7 50.8 select a sample of 40 of the new trash bags. For 53.6 48.8 58.2 543 each of 40 consecutive hours, the first trash bag produced at or after a randomly selected time 53'0 58"] 56'1 483 during the hour is chosen. The bag is then 48-3 49-9 49-5 51-9 subjected to a breaking strength test. The 40 50.6 54.9 49.2 50.2 breaking strengths obtained are given in the 53.2 51.1 47.5 514 following table. Assume that the trash bag manufacturing process is operating consistently over tune. The following figure gives a percent frequency histogram of these breaking strengths, Type here to search of the distribution of breaking strengths. (10 Points) Describe where the breaking strengths seem to be concentrated. Also, describe and interpret the shape Analytical Exam 1 [ADM2623&EC X + Percent 0 N IA 6 10 46.0 46.5 O 47.0 47.5 48.0 48.5 49.0 49.5 3 18 Strength 52.0 52.5 53.0 Histogram 53. W 54.0 55. https://Ims.unb.ca/d21/le/content/177980/viewContent/1862994/View?ou=177980 56.0 56.5 57.0 57.5 58.0 58.5 The following figure gives a percent frequency histogram of these breaking strengths. 59.0 ENG 2020-10-22 12:03 PM $4 0>> 73 . . . XAnalytical Exam 1 [ADM2623&EC X + X O & https://Ims.unb.ca/d21/le/content/177980/viewContent/1862994/View?ou=177980 . . . ADM2623/ECON3601: Business Statistics Instructor: Alireza Tajbakhsh UNB UNIVERSITY OF NEW BRUNSWICK Question 2 (Non-Software Part). Using the data set given in Question 1, find the sample mean and explain if the sample mean provides descriptive evidence that the mean of the population of all possible trash bag breaking strengths is at least 50.5 pounds. What percentage of the sample observations are above 50.5 pounds? (10 Points) Question 3 (Non-Software Part). Using the data set given in Question 1, find the sample standard deviation if $2 = Li=1(xi-*)2 n-1 . (10 Points) + 4 18 $4 0>> Type here to search O W ENG 12:03 PM 2020-10-22 73B Analytical Exam 1 [ADM2623&EC X + X O https://Ims.unb.ca/d21/le/content/177980/viewContent/1862994/View?ou=177980 . . . ADM2623/ECON3601: Business Statistics Instructor: Alireza Tajbakhsh DUNB UNIVERSITY OF NEW BRUNSWICK Question 4 (Non-Software Part). In the data set given in Question 1, the skewness is 0.53 (relatively close to zero) that implies that the population of all possible trash bag breaking strengths is approximately normally distributed. Here, you need to testify the normality of the population using the 2-standard-deviation range of the empirical rule (or, the 95.44% rule). Construct this range and determine what percentage of the above sample is within the [x - 2s, x + 2s] interval. (10 Points) Question 5 (Non-Software Part). At a university 70 percent of the students are women and 50 percent + 5 1 8 $4 0>> Type here to search O O ENG 12:04 PM 2020-10-22Analytical Exam 1 [ADM2623&EC X + X O & https://Ims.unb.ca/d21/le/content/177980/viewContent/1862994/View?ou=177980 . . . Question 5 (Non-Software Part). At a university, 70 percent of the students are women, and 50 percent of the students receive a grade of C. Also, 25 percent of the students are neither female nor C-grade students. Complete the following contingency table using the concepts discussed in Chapters 2-4. (10 Points) C-Grade Students Other Students Women 70% Men 50% 100% + 5 18 $4 0>> Type here to search O m w O ENG 12:04 PM 2020-10-22B Analytical Exam 1 [ADM2623&EC X + X O https://Ims.unb.ca/d21/le/content/177980/viewContent/1862994/View?ou=177980 . . . ADM2623/ECON3601: Business Statistics Instructor: Alireza Tajbakhsh DUNB UNIVERSITY OF NEW BRUNSWICK Question 6 (Non-Software Part). Container 1 has 8 items, 3 of which are defective. Container 2 has 5 items, 2 of which are defective. If one item is drawn from each container, what is the probability that only one of the items is defective? (10 Points) + 6 18 $4 0>> Type here to search O m W ENG 12:04 PM 2020-10-22B Analytical Exam 1 [ADM2623&EC X + X O & https://Ims.unb.ca/d21/le/content/177980/viewContent/1862994/View?ou=177980 . . . Question 7 (Non-Software Part). A manager has just received the expense checks for six of her employees. She randomly distributes the checks to the six employees. What is the probability that exactly five of them will receive the correct checks (checks with the correct names)? (10 Points) + 6 18 $4 0>> Type here to search O m w ENG 12:04 PM 2020-10-22Analytical Exam 1 [ADM2623&EC X + X O & https://Ims.unb.ca/d21/le/content/177980/viewContent/1862994/View?ou=177980 . . . ADM2623/ECON3601: Business Statistics Instructor: Alireza Tajbakhsh DUNB UNIVERSITY OF NEW BRUNSWICK Question 8 (Non-Software Part). Researchers wish to study fuel consumption rates based on speed. The data from 10 cars are below. Calculate the sample correlation coefficient. Also, explain what this value represents about the relationship between "speed" and "fuel consumption rates." (20 Points) Speed Miles/ Gallon 15 14 23 17 30 20 35 24 42 26 45 23 50 18 54 15 60 60 65 10 + 7 18 Type here to search O m W ENG 12:04 PM 2020-10-22
