Answered step by step
Verified Expert Solution
Question
1 Approved Answer
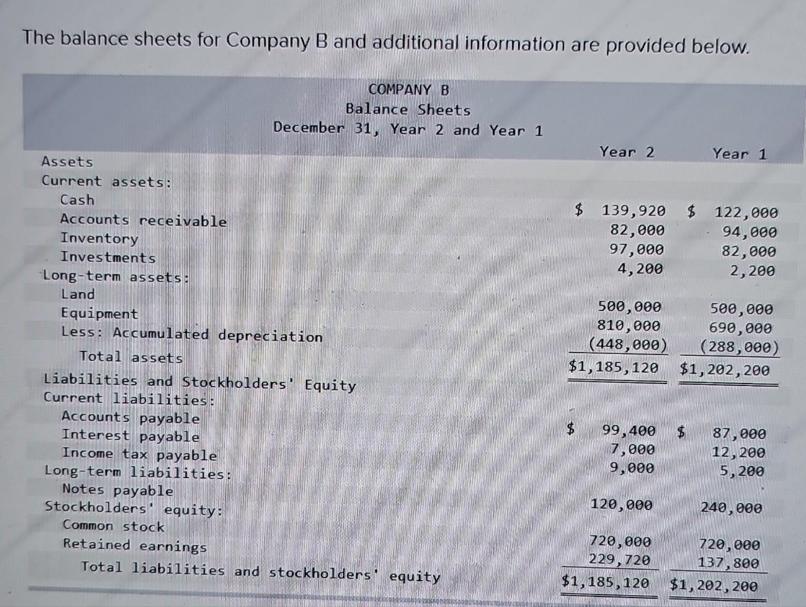
The balance sheets for Company B and additional information are provided below. COMPANY B Balance Sheets December 31, Year 2 and Year 1 Assets


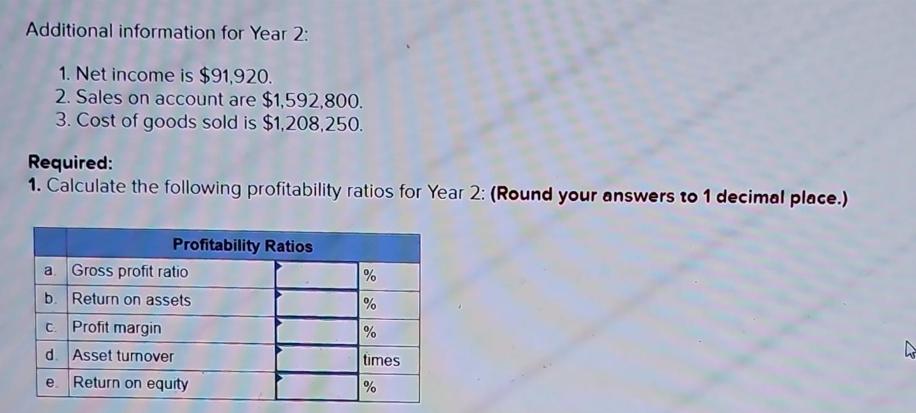
The balance sheets for Company B and additional information are provided below. COMPANY B Balance Sheets December 31, Year 2 and Year 1 Assets Current assets: Cash Accounts receivable Inventory Investments Long-term assets: Land Equipment Less: Accumulated depreciation Total assets Liabilities and Stockholders' Equity Current liabilities: Accounts payable Interest payable Income tax payable Long-term liabilities: Notes payable Stockholders equity: Common stock Retained earnings Total liabilities and stockholders' equity Year 2 $ 139,920 $ 122,000 82,000 94,000 97,000 82,000 4, 200 2,200 $ 500,000 500,000 810,000 690,000 (448,000) (288,000) $1,185,120 $1,202,200 99,400 7,000 9,000 120,000 Year 1 720,000 229,720 $1,185,120 $ 87,000 12, 200 5,200 240,000 720,000 137,800 $1,202, 200 Additional information for Year 2: 1. Net income is $91,920. 2. Sales on account are $1,592,800. 3. Cost of goods sold is $1,208,250. Required: 1. Calculate the following profitability ratios for Year 2: (Round your answers to 1 decimal place.) Profitability Ratios a Gross profit ratio b. Return on assets c. Profit margin d. Asset turnover e Return on equity % % % times % W 2. When we compare two companies, can one have a higher return on assets while the other has a higher return on equity?
Step by Step Solution
There are 3 Steps involved in it
Step: 1
To calculate the profitability ratios for Year 2 well use the following formulas a Gross profit rati...
Get Instant Access to Expert-Tailored Solutions
See step-by-step solutions with expert insights and AI powered tools for academic success
Step: 2

Step: 3

Ace Your Homework with AI
Get the answers you need in no time with our AI-driven, step-by-step assistance
Get Started


