

Answered step by step
Verified Expert Solution
Question
1 Approved Answer
that the population of weights of all the plastic medals is approximately normally distributed. The manufacturer claims that the standard deviation of this population
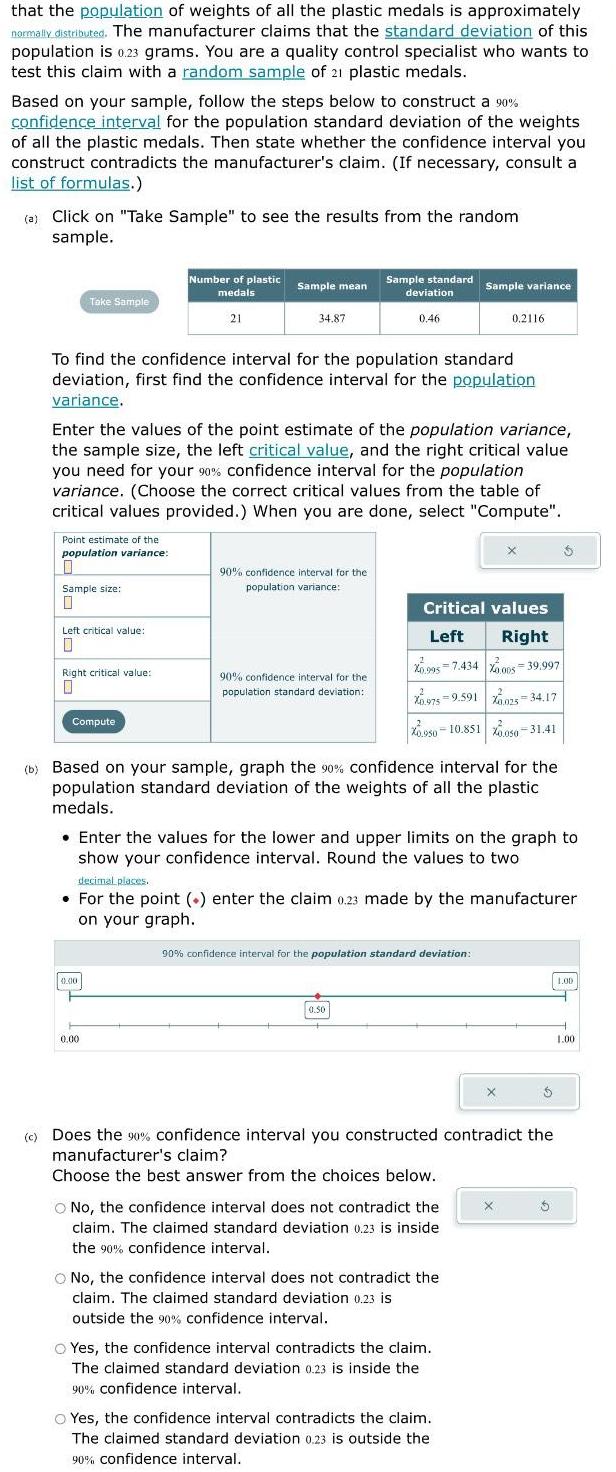
that the population of weights of all the plastic medals is approximately normally distributed. The manufacturer claims that the standard deviation of this population is 0.23 grams. You are a quality control specialist who wants to test this claim with a random sample of 21 plastic medals. Based on your sample, follow the steps below to construct a 90% confidence interval for the population standard deviation of the weights of all the plastic medals. Then state whether the confidence interval you construct contradicts the manufacturer's claim. (If necessary, consult a list of formulas.) (a) Click on "Take Sample" to see the results from the random sample. Number of plastic medals Sample mean Sample standard deviation Sample variance Take Sample 21 34.87 0.46 0.2116 To find the confidence interval for the population standard deviation, first find the confidence interval for the population variance. Enter the values of the point estimate of the population variance, the sample size, the left critical value, and the right critical value you need for your 90% confidence interval for the population variance. (Choose the correct critical values from the table of critical values provided.) When you are done, select "Compute". Point estimate of the population variance: Sample size: Left critical value: 90% confidence interval for the population variance: Critical values Left Right X0.995 7.434 000s 39.997 Right critical value: 90% confidence interval for the population standard deviation: 2 Compute 0.975 9.591 0.025-34.17 0.950 10.851 050-31.41 (b) Based on your sample, graph the 90% confidence interval for the population standard deviation of the weights of all the plastic medals. Enter the values for the lower and upper limits on the graph to show your confidence interval. Round the values to two decimal places. For the point () enter the claim 0.23 made by the manufacturer on your graph. 90% confidence interval for the population standard deviation: 0.00 0.501 (c) Does the 90% confidence interval you constructed contradict the manufacturer's claim? Choose the best answer from the choices below. No, the confidence interval does not contradict the claim. The claimed standard deviation 0.23 is inside the 90% confidence interval. No, the confidence interval does not contradict the claim. The claimed standard deviation 0.23 is outside the 90% confidence interval. Yes, the confidence interval contradicts the claim. The claimed standard deviation 0.23 is inside the 90% confidence interval. Yes, the confidence interval contradicts the claim. The claimed standard deviation 0.23 is outside the 90% confidence interval. 1.00 1.00
Step by Step Solution
There are 3 Steps involved in it
Step: 1

Get Instant Access to Expert-Tailored Solutions
See step-by-step solutions with expert insights and AI powered tools for academic success
Step: 2

Step: 3
Ace Your Homework with AI
Get the answers you need in no time with our AI-driven, step-by-step assistance
Get Started
Forecasting Time Series And Regression
Authors: Bruce L. Bowerman, Richard O'Connell, Anne Koehler
4th Edition
0534409776, 9780534409777