Answered step by step
Verified Expert Solution
Question
1 Approved Answer
thats why I posted the question so you can solve it I don't have it that's why I posted the question so it can be
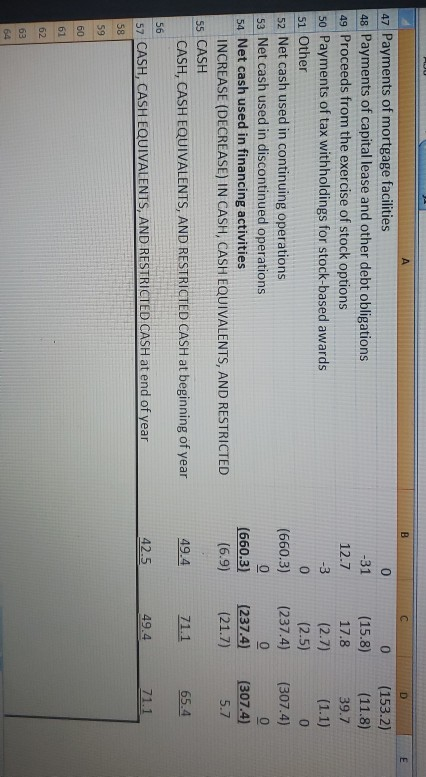
thats why I posted the question so you can solve it
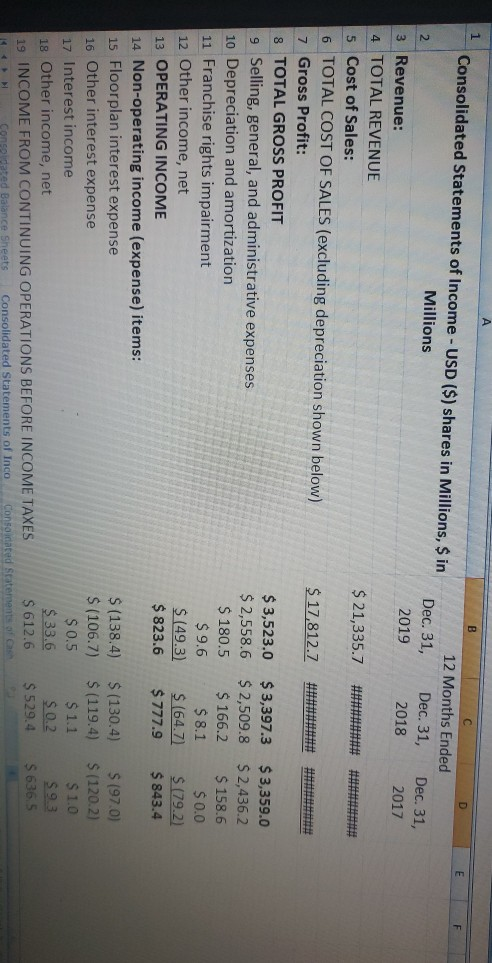
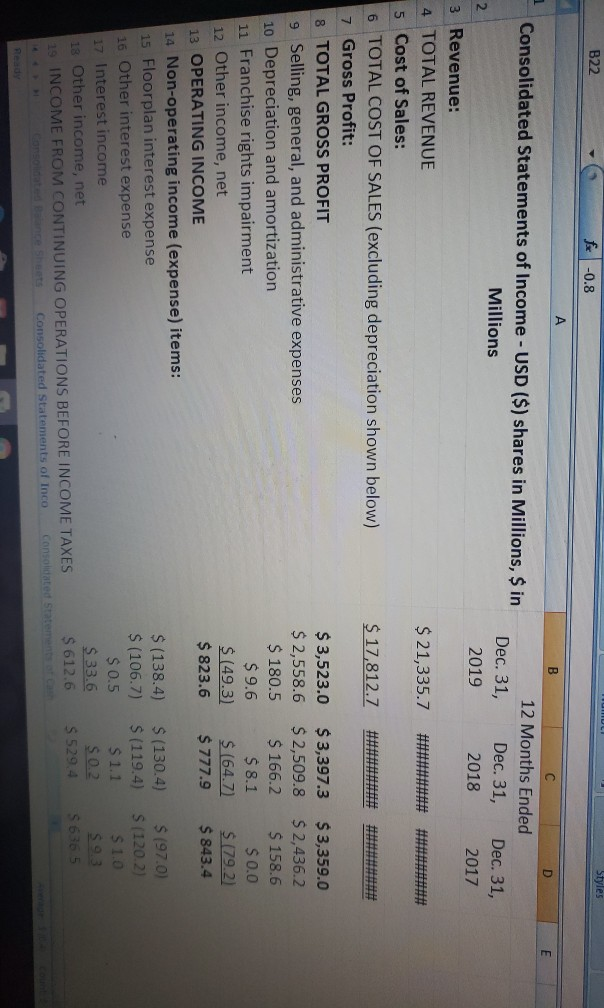
I don't have it that's why I posted the question so it can be solved and this is due today and you keep sending clarification this the only the data I have
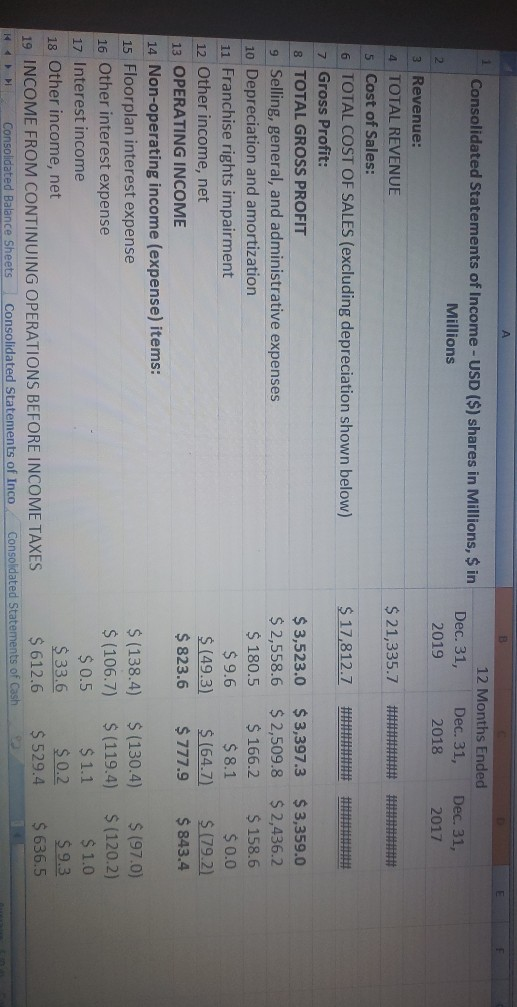
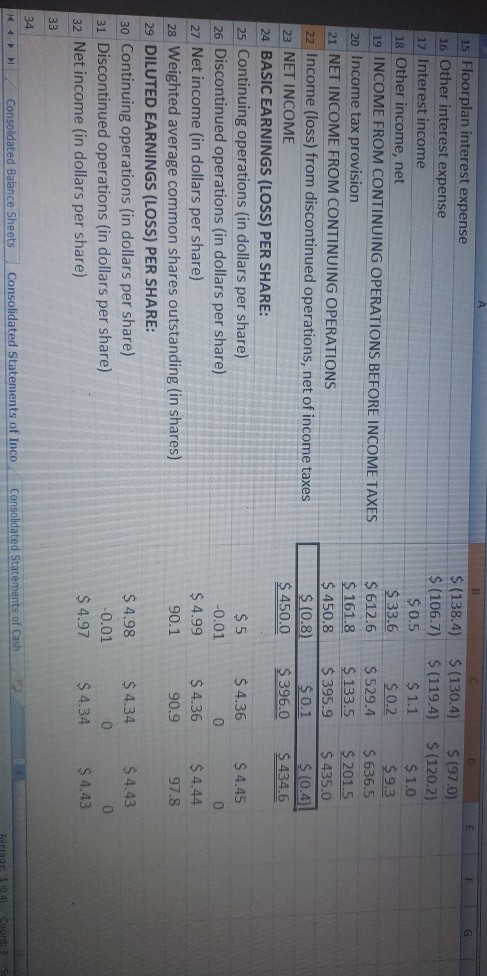
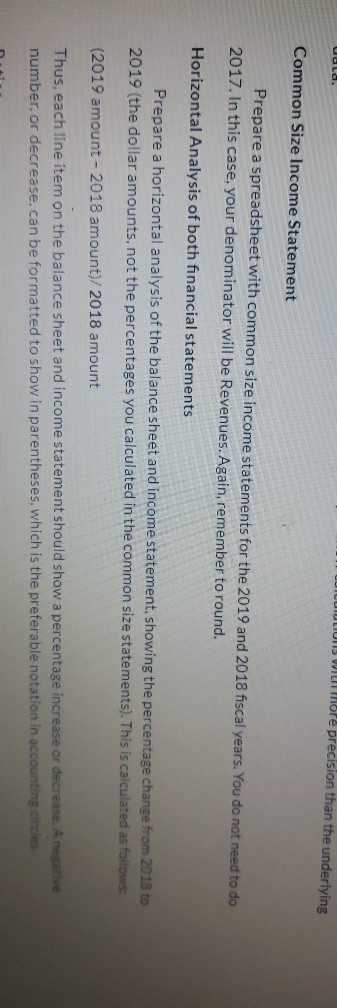
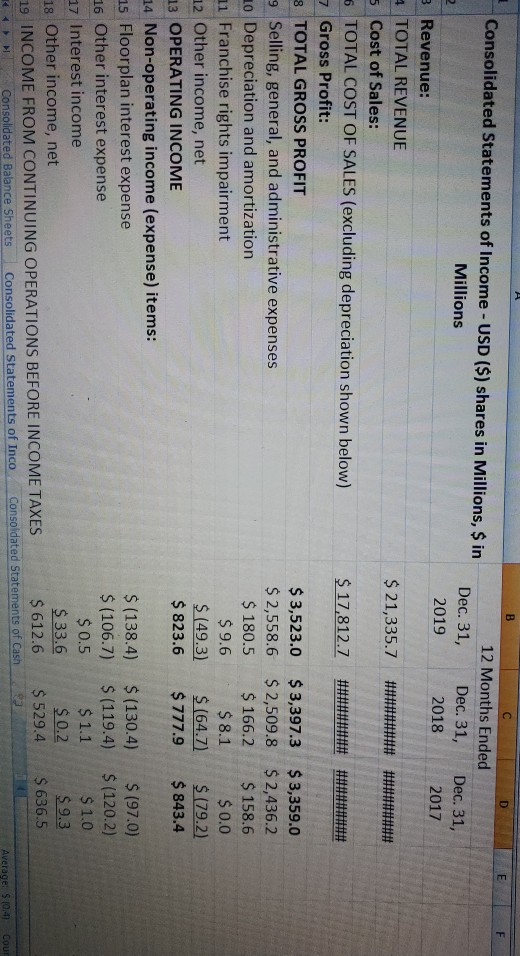
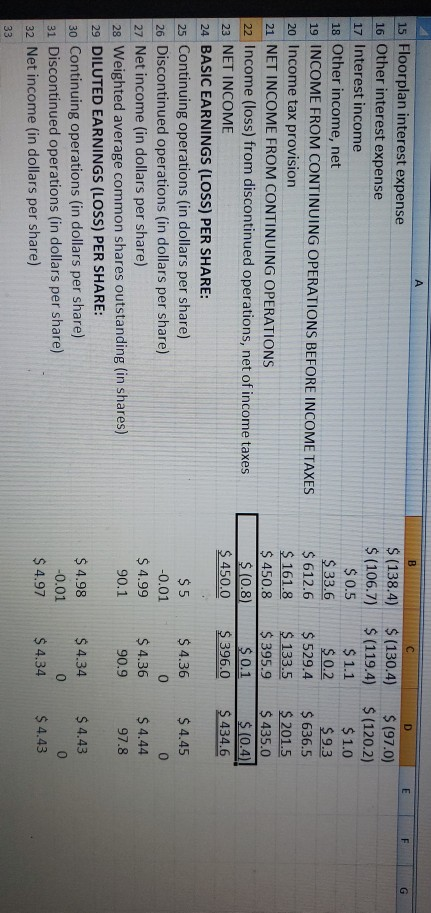
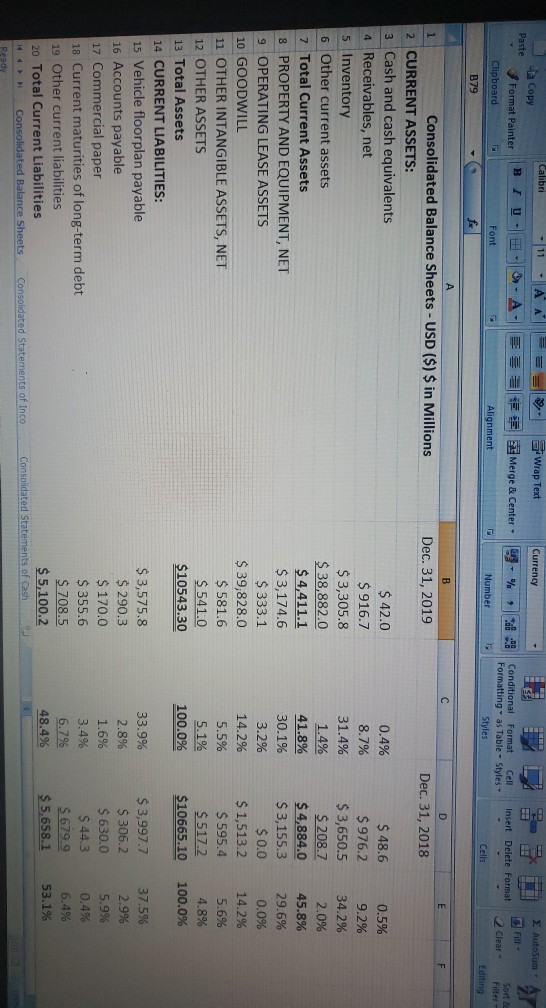
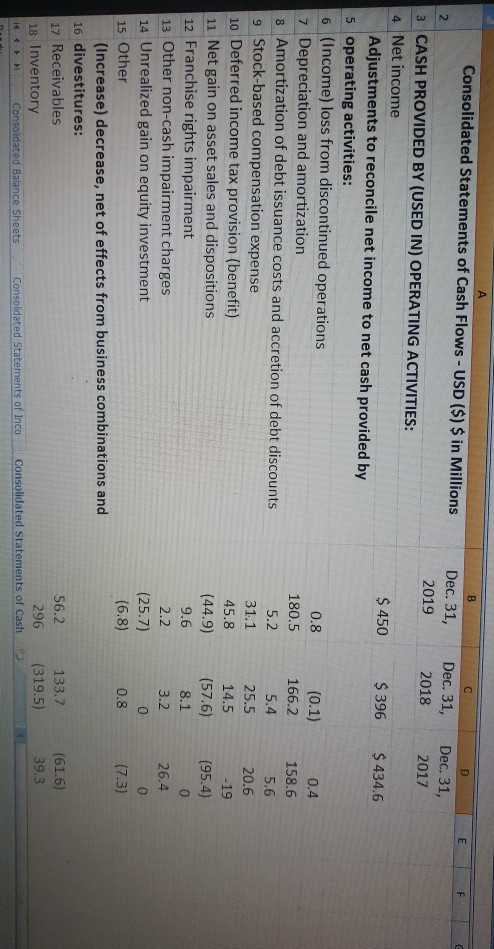
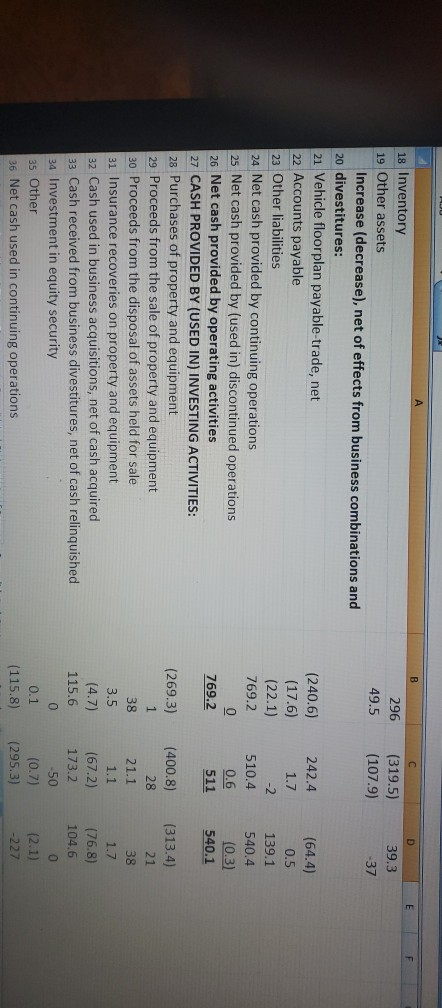
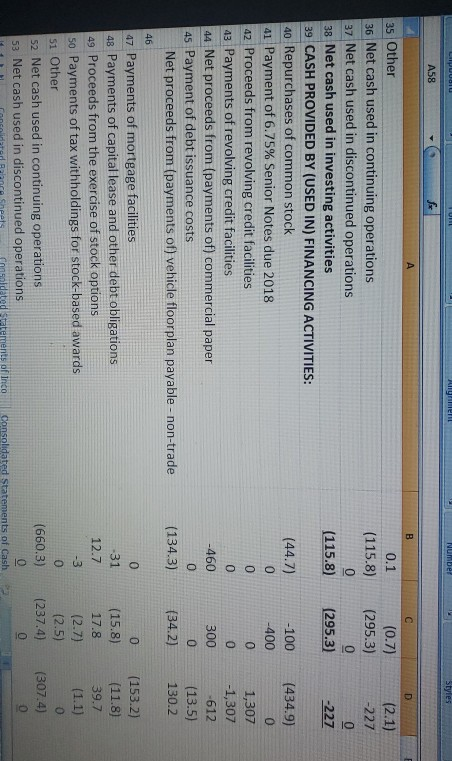
Uola. UTULIUNTS WII more precision than the underlying Common Size Income Statement Prepare a spreadsheet with common size income statements for the 2019 and 2018 fiscal years. You do not need to do 2017. In this case, your denominator will be Revenues. Again, remember to round. Horizontal Analysis of both financial statements Prepare a horizontal analysis of the balance sheet and income statement, showing the percentage change from 2018 to 2019 (the dollar amounts, not the percentages you calculated in the common size statements). This is calculated as follows: (2019 amount - 2018 amount)/2018 amount Thus, each line item on the balance sheet and income statement should show a percentage increase or decrease. A negative number, or decrease. can be formatted to show in parentheses, which is the preferable notation in accounting circles B E F 10 D Consolidated Statements of Income - USD ($) shares in Millions, $ in 12 Months Ended Millions Dec. 31, Dec. 31, Dec. 31, 2019 2018 2017 3 Revenue: 4 TOTAL REVENUE $ 21,335.7 5 Cost of Sales: 6 TOTAL COST OF SALES (excluding depreciation shown below) $ 17,812.7 7 Gross Profit: 8 TOTAL GROSS PROFIT $ 3,523.0 $ 3,397.3 $ 3,359.0 9 Selling, general, and administrative expenses $ 2,558.6 $ 2,509.8 $ 2,436.2 10 Depreciation and amortization $ 180.5 $ 166.2 $ 158.6 11 Franchise rights impairment $ 9.6 $ 8.1 $ 0.0 12 Other income, net $ (49.3) $ (64.7) $ (79.2) 13 OPERATING INCOME $ 823.6 $ 777.9 $ 843.4 14 Non-operating income (expense) items: 15 Floorplan interest expense $(138.4) $ (130.4) $ (97.0) 16 Other interest expense $(106.7) $(119.4) $ (120.2) $ 0.5 $ 1.1 $ 1.0 17 Interest income $ 33.6 $ 0.2 $ 9.3 18 Other income, net $ 612.6 $ 529.4 $ 636.5 19 INCOME FROM CONTINUING OPERATIONS BEFORE INCOME TAXES Consolidated Statements of Cash e Consolidated Statements of Inco Consolidated Balance Sheets Average: 5 10:41 Cour A B D F F G 15 Floorplan interest expense 16 Other interest expense 17 Interest income 18 Other income, net 19 INCOME FROM CONTINUING OPERATIONS BEFORE INCOME TAXES 20 Income tax provision 21 NET INCOME FROM CONTINUING OPERATIONS 22 Income (loss) from discontinued operations, net of income taxes 23 NET INCOME 24 BASIC EARNINGS (LOSS) PER SHARE: 25 Continuing operations (in dollars per share) 26 Discontinued operations (in dollars per share) 27 Net income (in dollars per share) 28 Weighted average common shares outstanding (in shares) 29 DILUTED EARNINGS (LOSS) PER SHARE: 30 Continuing operations (in dollars per share) 31 Discontinued operations (in dollars per share) 32 Net income (in dollars per share) $ (138.4) $(106.7) $ 0.5 $ 33.6 $ 612.6 $ 161.8 $ 450.8 $ (0.8) $ 450.0 $(130.4) $(119.4) $ 1.1 $ 0.2 $ 529.4 $ 133.5 $395.9 $ 0.1 $ 396.0 $ (97.0) $(120.2) $ 1.0 $ 9.3 $ 636.5 $201.5 $ 435.0 $ (0.4) $ 434.6 $4.36 $ 5 -0.01 $4.99 90.1 $ 4.45 0 $ 4.44 97.8 $ 4.36 90.9 $ 4.98 -0.01 $ 4.97 $4.34 0 $ 4.34 $ 4.43 0 $ 4.43 33 Calibri 11 A Wrap Text Currency Autos Paste Copy Format Painter Clipboard . Merge & Center %. Insert Delete Format Conditional Format Cell Formatting as Table - Styles Styles Clear Font Alignment Number Sorte Filter Editing Cells B79 f D E F Dec 31, 2018 0.4% A B 1 Consolidated Balance Sheets - USD ($) $ in Millions Dec. 31, 2019 2 CURRENT ASSETS: 3 Cash and cash equivalents $ 42.0 4 Receivables, net $ 916.7 5 Inventory $ 3,305.8 6 Other current assets $ 38,882.0 7 Total Current Assets $ 4,411.1 8 PROPERTY AND EQUIPMENT, NET $ 3,174.6 9 OPERATING LEASE ASSETS $ 333.1 10 GOODWILL $ 39,828.0 11 OTHER INTANGIBLE ASSETS, NET $ 581.6 12 OTHER ASSETS $ 541.0 13 Total Assets $10543.30 14 CURRENT LIABILITIES: 15 Vehicle floor plan payable $ 3,575.8 16 Accounts payable $ 290.3 17 Commercial paper $ 170.0 18 Current maturities of long-term debt $ 355.6 19 Other current liabilities $ 708.5 20 Total Current Liabilities $ 5,100.2 Consolidated Balance Sheets Consolidated Statements of Inco Consolidated Statements of Cash 8.7% 31.4% 1.4% 41.8% 30.1% 3.2% 14.2% 5.5% 5.1% 100.0% $ 48.6 $ 976.2 $ 3,650.5 $ 208.7 $ 4,884.0 $ 3,155.3 $ 0.0 $ 1,513.2 $ 595.4 $ 517.2 $10665.10 0.5% 9.2% 34.2% 2.0% 45.8% 29.6% 0.0% 14.2% 5.6% 4.8% 100.0% 33.9% 2.8% 1.6% 3.4% 6.7% 48.4% $ 3,997.7 $ 306.2 $ 630.0 S 44.3 $ 679.9 $ 5,658.1 37.5% 2.9% 5.9% 0.4% 6.4% 53.1% F F Dec. 31, 2018 Dec. 31, 2017 $ 396 $434.6 A B Consolidated Statements of Cash Flows - USD ($) $ in Millions Dec. 31, 2 2019 3 CASH PROVIDED BY (USED IN) OPERATING ACTIVITIES: 4 Net income $ 450 Adjustments to reconcile net income to net cash provided by 5 operating activities: 6 (Income) loss from discontinued operations 0.8 7 Depreciation and amortization 180.5 8 Amortization of debt issuance costs and accretion of debt discounts 5.2 9 Stock-based compensation expense 31.1 10 Deferred income tax provision (benefit) 45.8 11 Net gain on asset sales and dispositions (44.9) 12 Franchise rights impairment 9.6 13 Other non-cash impairment charges 2.2 14 Unrealized gain on equity investment (25.7) 15 Other (6.8) (Increase) decrease, net of effects from business combinations and 16 divestitures: 17 Receivables 56.2 296 18 Inventory Consolidated Balance Sheets Consolidated Statements of Inco Consolidated Statements of Cash (0.1) 166.2 5.4 25.5 14.5 (57.6) 8.1 0.4 158.6 5.6 20.6 -19 (95.4) 3.2 26.4 0 0 0.8 (7.3) 133.7 (319.5) (61.6) 39.3 K4 B F F 296 49.5 (319.5) (107.9) D 39.3 37 18 Inventory 19 Other assets Increase (decrease), net of effects from business combinations and 20 divestitures: 21 Vehicle floorplan payable-trade, net 22 Accounts payable 23 Other liabilities 24 Net cash provided by continuing operations 25 Net cash provided by (used in) discontinued operations 26 Net cash provided by operating activities 27 CASH PROVIDED BY (USED IN) INVESTING ACTIVITIES: 28 Purchases of property and equipment 29 Proceeds from the sale of property and equipment 30 Proceeds from the disposal of assets held for sale 31 Insurance recoveries on property and equipment 32 Cash used in business acquisitions, net of cash acquired 33 Cash received from business divestitures, net of cash relinquished 34 Investment in equity security 35 Other 36 Net cash used in continuing operations (240.6) (17.6) (22.1) 769.2 0 769.2 242.4 1.7 -2 510.4 0.6 511 (64.4) 0.5 139.1 540.4 (0.3) 540.1 (269.3) 1 38 3.5 (4.7) 115.6 (400.8) 28 21.1 1.1 (67.2) 173.2 50 (0.7) (295.3) (313.4) 21 38 1.7 (76.8) 104.6 0 (2.1) -227 0 0.1 (115.8) LIPUU UNE Allgher Number Styles A58 f A B D 0.1 (115.8) 0 (115.8) (0.7) (295.3) 0 (295.3) (2.1) -227 0 -227 35 Other 36 Net cash used in continuing operations 37 Net cash used in discontinued operations 38 Net cash used in investing activities 39 CASH PROVIDED BY (USED IN) FINANCING ACTIVITIES: 40 Repurchases of common stock 41 Payment of 6.75% Senior Notes due 2018 42 Proceeds from revolving credit facilities 43 Payments of revolving credit facilities 44 Net proceeds from (payments of) commercial paper 45 Payment of debt issuance costs Net proceeds from (payments of) vehicle floorplan payable - non-trade -100 -400 0 (44.7) 0 0 0 -460 0 (134.3) 0 300 0 (34.2) (434.9) 0 1,307 -1,307 -612 (13.5) 130.2 46 0 47 Payments of mortgage facilities 48 Payments of capital lease and other debt obligations 49 Proceeds from the exercise of stock options 50 Payments of tax withholdings for stock-based awards 51 Other 52 Net cash used in continuing operations 53 Net cash used in discontinued operations 0 31 12.7 -3 (153.2) (11.8) 39.7 (1.1) (15.8) 17.8 (2.7) (2.5) (237.4) 0 (307.4) 0 (660.3) 0 Consolidated Statements of Cash dated Statements of Inco B D F 0 A 47 Payments of mortgage facilities 48 Payments of capital lease and other debt obligations 49 Proceeds from the exercise of stock options 50 Payments of tax withholdings for stock-based awards 51 Other 52 Net cash used in continuing operations 53 Net cash used in discontinued operations 54 Net cash used in financing activities INCREASE (DECREASE) IN CASH, CASH EQUIVALENTS, AND RESTRICTED 55 CASH CASH, CASH EQUIVALENTS, AND RESTRICTED CASH at beginning of year 56 57 CASH, CASH EQUIVALENTS, AND RESTRICTED CASH at end of year 0 -31 12.7 -3 0 (660.3) 0 (660.3) (6.9) (15.8) 17.8 (2.7) (2.5) (237.4) 0 (237.4) (21.7) (153.2) (11.8) 39.7 (1.1) 0 (307.4) 0 (307.4) 5.7 49.4 71.1 65.4 42.5 49.4 71.1 58 59 60 61 62 63 64 1 Consolidated Statements of Income - USD ($) shares in Millions, $ in 12 Months Ended Millions Dec. 31, Dec. 31, 2 Dec. 31, 2019 3 Revenue: 2018 2017 4 TOTAL REVENUE $ 21,335.7 5 Cost of Sales: 6 TOTAL COST OF SALES (excluding depreciation shown below) $ 17,812.7 7 Gross Profit: 8 TOTAL GROSS PROFIT $ 3,523.0 $ 3,397.3 $ 3,359.0 9 Selling, general, and administrative expenses $ 2,558.6 $ 2,509.8 $ 2,436.2 10 Depreciation and amortization $ 180.5 $ 166.2 $ 158.6 11 Franchise rights impairment $ 9.6 $ 8.1 $ 0.0 12 Other income, net $ (49.3) $ (64.7) $ 179.2) 13 OPERATING INCOME $ 823.6 $ 777.9 $ 843.4 14 Non-operating income (expense) items: 15 Floorplan interest expense S (138.4) $(130.4) $197.0) 16 Other interest expense $ (106.7) $(119.4) S (120.2) $ 0.5 $ 1.1 $ 1.0 17 Interest income $ 33,6 $0.2 $93 18 Other income, net S 612.6 $ 529.4 $ 636.5 19 INCOME FROM CONTINUING OPERATIONS BEFORE INCOME TAXES solidated Balance Sheets Consolidated Statements of Inco Consoldated Statements of MULI B22 Styles fx -0.8 B D Consolidated Statements of Income - USD ($) shares in Millions, $ in 12 Months Ended Millions Dec. 31, Dec. 31, Dec. 31, 2 2019 2018 2017 3 Revenue: 4 TOTAL REVENUE $ 21,335.7 5 Cost of Sales: 6 TOTAL COST OF SALES (excluding depreciation shown below) $ 17,812.7 7 Gross Profit: 8 TOTAL GROSS PROFIT $ 3,523.0 $ 3,397.3 $ 3,359.0 9 Selling, general, and administrative expenses $ 2,558.6 $ 2,509.8 $ 2,436.2 10 Depreciation and amortization $ 180.5 $ 166.2 $ 158.6 11 Franchise rights impairment $ 9.6 $ 8.1 $ 0.0 12 Other income, net $ (49.3) $ (64.7) $ 792) 13 OPERATING INCOME $ 823.6 $ 777.9 $ 843.4 14 Non-operating income (expense) items: 15 Floorplan interest expense $(138.4) $ (130.4) $ (97.0) $ (106.7) 16 Other interest expense S (119.4) S (120.2 $ 0.5 $ 1.1 $ 1.0 17 Interest income $ 33.6 $0.2 $93 18 Other income, net $ 612.6 $ 529.4 56365 19 INCOME FROM CONTINUING OPERATIONS BEFORE INCOME TAXES Consolidated Statements of Inco Consolidated Statement 6 7 B 1 Consolidated Statements of Income - USD ($) shares in Millions, $ in 12 Months Ended Millions Dec. 31, Dec. 31, Dec. 31, 2 2019 2018 2017 3 Revenue: 4 TOTAL REVENUE $ 21,335.7 5 Cost of Sales: TOTAL COST OF SALES (excluding depreciation shown below) $ 17,812.7 Gross Profit: 8 TOTAL GROSS PROFIT $ 3,523.0 $ 3,397.3 $ 3,359.0 9 Selling, general, and administrative expenses $ 2,558.6 $ 2,509.8 $ 2,436.2 10 Depreciation and amortization $ 180.5 $ 166.2 $ 158.6 11 Franchise rights impairment $ 9.6 $ 8.1 $ 0.0 12 Other income, net $ (49.3) $ (64.7) $ (79.21 13 OPERATING INCOME $ 823.6 $ 777.9 $ 843.4 14 Non-operating income (expense) items: 15 Floorplan interest expense $ (138.4) $(130.4) $197.0) 16 Other interest expense $ (106.7) $ (119.4) $ (120.2) 17 Interest income $ 1.1 $ 1.0 18 Other income, net $ 33.6 $ 0.2 $9.3 19 INCOME FROM CONTINUING OPERATIONS BEFORE INCOME TAXES $ 612.6 $ 529.4 $ 636.5 HI Consolidated Balance Sheets Consolidated Statements of Inco Consolidated Statements of Cash $ 0.5 $ (138.4) $ (106.7) $ 0.5 $ 33.6 $ 612.6 $ 161.8 $ 450.8 $ (0.8) $ 450.0 $ (130.4) $ (119.4) $ 1.1 $0.2 $ 529.4 $ 133.5 $ 395.9 $ 0.1 $ 396.0 $ (97.0) $ (120.2) $ 1.0 $9.3 $ 636.5 $ 201,5 $ 435.0 $ (0.4) $ 434.6 15 Floorplan interest expense 16 Other interest expense 17 Interest income 18 Other income, net 19 INCOME FROM CONTINUING OPERATIONS BEFORE INCOME TAXES 20 Income tax provision 21 NET INCOME FROM CONTINUING OPERATIONS 22 Income (loss) from discontinued operations, net of income taxes 23 NET INCOME 24 BASIC EARNINGS (LOSS) PER SHARE: 25 Continuing operations (in dollars per share) 26 Discontinued operations (in dollars per share) 27 Net income (in dollars per share) 28 Weighted average common shares outstanding (in shares) 29 DILUTED EARNINGS (LOSS) PER SHARE: 30 Continuing operations (in dollars per share) 31 Discontinued operations (in dollars per share) 32 Net income (in dollars per share) $4.36 0. $ 5 -0.01 $ 4.99 90.1 $ 4.45 0 S4.44 97.8 $ 4.36 90.9 $ 4.98 -0.01 $ 4.97 $ 4.34 0 $ 4.34 $ 4.43 0 $ 4.43 33 34 H4 Consolidated Balance Sheets Consolidated Statements of Inco Consolidated Statements of Cash Uola. UTULIUNTS WII more precision than the underlying Common Size Income Statement Prepare a spreadsheet with common size income statements for the 2019 and 2018 fiscal years. You do not need to do 2017. In this case, your denominator will be Revenues. Again, remember to round. Horizontal Analysis of both financial statements Prepare a horizontal analysis of the balance sheet and income statement, showing the percentage change from 2018 to 2019 (the dollar amounts, not the percentages you calculated in the common size statements). This is calculated as follows: (2019 amount - 2018 amount)/2018 amount Thus, each line item on the balance sheet and income statement should show a percentage increase or decrease. A negative number, or decrease. can be formatted to show in parentheses, which is the preferable notation in accounting circles B E F 10 D Consolidated Statements of Income - USD ($) shares in Millions, $ in 12 Months Ended Millions Dec. 31, Dec. 31, Dec. 31, 2019 2018 2017 3 Revenue: 4 TOTAL REVENUE $ 21,335.7 5 Cost of Sales: 6 TOTAL COST OF SALES (excluding depreciation shown below) $ 17,812.7 7 Gross Profit: 8 TOTAL GROSS PROFIT $ 3,523.0 $ 3,397.3 $ 3,359.0 9 Selling, general, and administrative expenses $ 2,558.6 $ 2,509.8 $ 2,436.2 10 Depreciation and amortization $ 180.5 $ 166.2 $ 158.6 11 Franchise rights impairment $ 9.6 $ 8.1 $ 0.0 12 Other income, net $ (49.3) $ (64.7) $ (79.2) 13 OPERATING INCOME $ 823.6 $ 777.9 $ 843.4 14 Non-operating income (expense) items: 15 Floorplan interest expense $(138.4) $ (130.4) $ (97.0) 16 Other interest expense $(106.7) $(119.4) $ (120.2) $ 0.5 $ 1.1 $ 1.0 17 Interest income $ 33.6 $ 0.2 $ 9.3 18 Other income, net $ 612.6 $ 529.4 $ 636.5 19 INCOME FROM CONTINUING OPERATIONS BEFORE INCOME TAXES Consolidated Statements of Cash e Consolidated Statements of Inco Consolidated Balance Sheets Average: 5 10:41 Cour A B D F F G 15 Floorplan interest expense 16 Other interest expense 17 Interest income 18 Other income, net 19 INCOME FROM CONTINUING OPERATIONS BEFORE INCOME TAXES 20 Income tax provision 21 NET INCOME FROM CONTINUING OPERATIONS 22 Income (loss) from discontinued operations, net of income taxes 23 NET INCOME 24 BASIC EARNINGS (LOSS) PER SHARE: 25 Continuing operations (in dollars per share) 26 Discontinued operations (in dollars per share) 27 Net income (in dollars per share) 28 Weighted average common shares outstanding (in shares) 29 DILUTED EARNINGS (LOSS) PER SHARE: 30 Continuing operations (in dollars per share) 31 Discontinued operations (in dollars per share) 32 Net income (in dollars per share) $ (138.4) $(106.7) $ 0.5 $ 33.6 $ 612.6 $ 161.8 $ 450.8 $ (0.8) $ 450.0 $(130.4) $(119.4) $ 1.1 $ 0.2 $ 529.4 $ 133.5 $395.9 $ 0.1 $ 396.0 $ (97.0) $(120.2) $ 1.0 $ 9.3 $ 636.5 $201.5 $ 435.0 $ (0.4) $ 434.6 $4.36 $ 5 -0.01 $4.99 90.1 $ 4.45 0 $ 4.44 97.8 $ 4.36 90.9 $ 4.98 -0.01 $ 4.97 $4.34 0 $ 4.34 $ 4.43 0 $ 4.43 33 Calibri 11 A Wrap Text Currency Autos Paste Copy Format Painter Clipboard . Merge & Center %. Insert Delete Format Conditional Format Cell Formatting as Table - Styles Styles Clear Font Alignment Number Sorte Filter Editing Cells B79 f D E F Dec 31, 2018 0.4% A B 1 Consolidated Balance Sheets - USD ($) $ in Millions Dec. 31, 2019 2 CURRENT ASSETS: 3 Cash and cash equivalents $ 42.0 4 Receivables, net $ 916.7 5 Inventory $ 3,305.8 6 Other current assets $ 38,882.0 7 Total Current Assets $ 4,411.1 8 PROPERTY AND EQUIPMENT, NET $ 3,174.6 9 OPERATING LEASE ASSETS $ 333.1 10 GOODWILL $ 39,828.0 11 OTHER INTANGIBLE ASSETS, NET $ 581.6 12 OTHER ASSETS $ 541.0 13 Total Assets $10543.30 14 CURRENT LIABILITIES: 15 Vehicle floor plan payable $ 3,575.8 16 Accounts payable $ 290.3 17 Commercial paper $ 170.0 18 Current maturities of long-term debt $ 355.6 19 Other current liabilities $ 708.5 20 Total Current Liabilities $ 5,100.2 Consolidated Balance Sheets Consolidated Statements of Inco Consolidated Statements of Cash 8.7% 31.4% 1.4% 41.8% 30.1% 3.2% 14.2% 5.5% 5.1% 100.0% $ 48.6 $ 976.2 $ 3,650.5 $ 208.7 $ 4,884.0 $ 3,155.3 $ 0.0 $ 1,513.2 $ 595.4 $ 517.2 $10665.10 0.5% 9.2% 34.2% 2.0% 45.8% 29.6% 0.0% 14.2% 5.6% 4.8% 100.0% 33.9% 2.8% 1.6% 3.4% 6.7% 48.4% $ 3,997.7 $ 306.2 $ 630.0 S 44.3 $ 679.9 $ 5,658.1 37.5% 2.9% 5.9% 0.4% 6.4% 53.1% F F Dec. 31, 2018 Dec. 31, 2017 $ 396 $434.6 A B Consolidated Statements of Cash Flows - USD ($) $ in Millions Dec. 31, 2 2019 3 CASH PROVIDED BY (USED IN) OPERATING ACTIVITIES: 4 Net income $ 450 Adjustments to reconcile net income to net cash provided by 5 operating activities: 6 (Income) loss from discontinued operations 0.8 7 Depreciation and amortization 180.5 8 Amortization of debt issuance costs and accretion of debt discounts 5.2 9 Stock-based compensation expense 31.1 10 Deferred income tax provision (benefit) 45.8 11 Net gain on asset sales and dispositions (44.9) 12 Franchise rights impairment 9.6 13 Other non-cash impairment charges 2.2 14 Unrealized gain on equity investment (25.7) 15 Other (6.8) (Increase) decrease, net of effects from business combinations and 16 divestitures: 17 Receivables 56.2 296 18 Inventory Consolidated Balance Sheets Consolidated Statements of Inco Consolidated Statements of Cash (0.1) 166.2 5.4 25.5 14.5 (57.6) 8.1 0.4 158.6 5.6 20.6 -19 (95.4) 3.2 26.4 0 0 0.8 (7.3) 133.7 (319.5) (61.6) 39.3 K4 B F F 296 49.5 (319.5) (107.9) D 39.3 37 18 Inventory 19 Other assets Increase (decrease), net of effects from business combinations and 20 divestitures: 21 Vehicle floorplan payable-trade, net 22 Accounts payable 23 Other liabilities 24 Net cash provided by continuing operations 25 Net cash provided by (used in) discontinued operations 26 Net cash provided by operating activities 27 CASH PROVIDED BY (USED IN) INVESTING ACTIVITIES: 28 Purchases of property and equipment 29 Proceeds from the sale of property and equipment 30 Proceeds from the disposal of assets held for sale 31 Insurance recoveries on property and equipment 32 Cash used in business acquisitions, net of cash acquired 33 Cash received from business divestitures, net of cash relinquished 34 Investment in equity security 35 Other 36 Net cash used in continuing operations (240.6) (17.6) (22.1) 769.2 0 769.2 242.4 1.7 -2 510.4 0.6 511 (64.4) 0.5 139.1 540.4 (0.3) 540.1 (269.3) 1 38 3.5 (4.7) 115.6 (400.8) 28 21.1 1.1 (67.2) 173.2 50 (0.7) (295.3) (313.4) 21 38 1.7 (76.8) 104.6 0 (2.1) -227 0 0.1 (115.8) LIPUU UNE Allgher Number Styles A58 f A B D 0.1 (115.8) 0 (115.8) (0.7) (295.3) 0 (295.3) (2.1) -227 0 -227 35 Other 36 Net cash used in continuing operations 37 Net cash used in discontinued operations 38 Net cash used in investing activities 39 CASH PROVIDED BY (USED IN) FINANCING ACTIVITIES: 40 Repurchases of common stock 41 Payment of 6.75% Senior Notes due 2018 42 Proceeds from revolving credit facilities 43 Payments of revolving credit facilities 44 Net proceeds from (payments of) commercial paper 45 Payment of debt issuance costs Net proceeds from (payments of) vehicle floorplan payable - non-trade -100 -400 0 (44.7) 0 0 0 -460 0 (134.3) 0 300 0 (34.2) (434.9) 0 1,307 -1,307 -612 (13.5) 130.2 46 0 47 Payments of mortgage facilities 48 Payments of capital lease and other debt obligations 49 Proceeds from the exercise of stock options 50 Payments of tax withholdings for stock-based awards 51 Other 52 Net cash used in continuing operations 53 Net cash used in discontinued operations 0 31 12.7 -3 (153.2) (11.8) 39.7 (1.1) (15.8) 17.8 (2.7) (2.5) (237.4) 0 (307.4) 0 (660.3) 0 Consolidated Statements of Cash dated Statements of Inco B D F 0 A 47 Payments of mortgage facilities 48 Payments of capital lease and other debt obligations 49 Proceeds from the exercise of stock options 50 Payments of tax withholdings for stock-based awards 51 Other 52 Net cash used in continuing operations 53 Net cash used in discontinued operations 54 Net cash used in financing activities INCREASE (DECREASE) IN CASH, CASH EQUIVALENTS, AND RESTRICTED 55 CASH CASH, CASH EQUIVALENTS, AND RESTRICTED CASH at beginning of year 56 57 CASH, CASH EQUIVALENTS, AND RESTRICTED CASH at end of year 0 -31 12.7 -3 0 (660.3) 0 (660.3) (6.9) (15.8) 17.8 (2.7) (2.5) (237.4) 0 (237.4) (21.7) (153.2) (11.8) 39.7 (1.1) 0 (307.4) 0 (307.4) 5.7 49.4 71.1 65.4 42.5 49.4 71.1 58 59 60 61 62 63 64 1 Consolidated Statements of Income - USD ($) shares in Millions, $ in 12 Months Ended Millions Dec. 31, Dec. 31, 2 Dec. 31, 2019 3 Revenue: 2018 2017 4 TOTAL REVENUE $ 21,335.7 5 Cost of Sales: 6 TOTAL COST OF SALES (excluding depreciation shown below) $ 17,812.7 7 Gross Profit: 8 TOTAL GROSS PROFIT $ 3,523.0 $ 3,397.3 $ 3,359.0 9 Selling, general, and administrative expenses $ 2,558.6 $ 2,509.8 $ 2,436.2 10 Depreciation and amortization $ 180.5 $ 166.2 $ 158.6 11 Franchise rights impairment $ 9.6 $ 8.1 $ 0.0 12 Other income, net $ (49.3) $ (64.7) $ 179.2) 13 OPERATING INCOME $ 823.6 $ 777.9 $ 843.4 14 Non-operating income (expense) items: 15 Floorplan interest expense S (138.4) $(130.4) $197.0) 16 Other interest expense $ (106.7) $(119.4) S (120.2) $ 0.5 $ 1.1 $ 1.0 17 Interest income $ 33,6 $0.2 $93 18 Other income, net S 612.6 $ 529.4 $ 636.5 19 INCOME FROM CONTINUING OPERATIONS BEFORE INCOME TAXES solidated Balance Sheets Consolidated Statements of Inco Consoldated Statements of MULI B22 Styles fx -0.8 B D Consolidated Statements of Income - USD ($) shares in Millions, $ in 12 Months Ended Millions Dec. 31, Dec. 31, Dec. 31, 2 2019 2018 2017 3 Revenue: 4 TOTAL REVENUE $ 21,335.7 5 Cost of Sales: 6 TOTAL COST OF SALES (excluding depreciation shown below) $ 17,812.7 7 Gross Profit: 8 TOTAL GROSS PROFIT $ 3,523.0 $ 3,397.3 $ 3,359.0 9 Selling, general, and administrative expenses $ 2,558.6 $ 2,509.8 $ 2,436.2 10 Depreciation and amortization $ 180.5 $ 166.2 $ 158.6 11 Franchise rights impairment $ 9.6 $ 8.1 $ 0.0 12 Other income, net $ (49.3) $ (64.7) $ 792) 13 OPERATING INCOME $ 823.6 $ 777.9 $ 843.4 14 Non-operating income (expense) items: 15 Floorplan interest expense $(138.4) $ (130.4) $ (97.0) $ (106.7) 16 Other interest expense S (119.4) S (120.2 $ 0.5 $ 1.1 $ 1.0 17 Interest income $ 33.6 $0.2 $93 18 Other income, net $ 612.6 $ 529.4 56365 19 INCOME FROM CONTINUING OPERATIONS BEFORE INCOME TAXES Consolidated Statements of Inco Consolidated Statement 6 7 B 1 Consolidated Statements of Income - USD ($) shares in Millions, $ in 12 Months Ended Millions Dec. 31, Dec. 31, Dec. 31, 2 2019 2018 2017 3 Revenue: 4 TOTAL REVENUE $ 21,335.7 5 Cost of Sales: TOTAL COST OF SALES (excluding depreciation shown below) $ 17,812.7 Gross Profit: 8 TOTAL GROSS PROFIT $ 3,523.0 $ 3,397.3 $ 3,359.0 9 Selling, general, and administrative expenses $ 2,558.6 $ 2,509.8 $ 2,436.2 10 Depreciation and amortization $ 180.5 $ 166.2 $ 158.6 11 Franchise rights impairment $ 9.6 $ 8.1 $ 0.0 12 Other income, net $ (49.3) $ (64.7) $ (79.21 13 OPERATING INCOME $ 823.6 $ 777.9 $ 843.4 14 Non-operating income (expense) items: 15 Floorplan interest expense $ (138.4) $(130.4) $197.0) 16 Other interest expense $ (106.7) $ (119.4) $ (120.2) 17 Interest income $ 1.1 $ 1.0 18 Other income, net $ 33.6 $ 0.2 $9.3 19 INCOME FROM CONTINUING OPERATIONS BEFORE INCOME TAXES $ 612.6 $ 529.4 $ 636.5 HI Consolidated Balance Sheets Consolidated Statements of Inco Consolidated Statements of Cash $ 0.5 $ (138.4) $ (106.7) $ 0.5 $ 33.6 $ 612.6 $ 161.8 $ 450.8 $ (0.8) $ 450.0 $ (130.4) $ (119.4) $ 1.1 $0.2 $ 529.4 $ 133.5 $ 395.9 $ 0.1 $ 396.0 $ (97.0) $ (120.2) $ 1.0 $9.3 $ 636.5 $ 201,5 $ 435.0 $ (0.4) $ 434.6 15 Floorplan interest expense 16 Other interest expense 17 Interest income 18 Other income, net 19 INCOME FROM CONTINUING OPERATIONS BEFORE INCOME TAXES 20 Income tax provision 21 NET INCOME FROM CONTINUING OPERATIONS 22 Income (loss) from discontinued operations, net of income taxes 23 NET INCOME 24 BASIC EARNINGS (LOSS) PER SHARE: 25 Continuing operations (in dollars per share) 26 Discontinued operations (in dollars per share) 27 Net income (in dollars per share) 28 Weighted average common shares outstanding (in shares) 29 DILUTED EARNINGS (LOSS) PER SHARE: 30 Continuing operations (in dollars per share) 31 Discontinued operations (in dollars per share) 32 Net income (in dollars per share) $4.36 0. $ 5 -0.01 $ 4.99 90.1 $ 4.45 0 S4.44 97.8 $ 4.36 90.9 $ 4.98 -0.01 $ 4.97 $ 4.34 0 $ 4.34 $ 4.43 0 $ 4.43 33 34 H4 Consolidated Balance Sheets Consolidated Statements of Inco Consolidated Statements of Cash
Step by Step Solution
There are 3 Steps involved in it
Step: 1

Get Instant Access to Expert-Tailored Solutions
See step-by-step solutions with expert insights and AI powered tools for academic success
Step: 2

Step: 3

Ace Your Homework with AI
Get the answers you need in no time with our AI-driven, step-by-step assistance
Get Started


