

Answered step by step
Verified Expert Solution
Question
1 Approved Answer
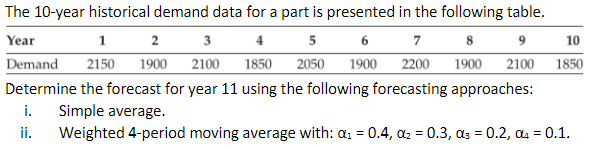
The 10-year historical demand data for a part is presented in the following table. Year H 2 3 5 6 7 8 9 10 Demand
Step by Step Solution
There are 3 Steps involved in it
Step: 1

Get Instant Access to Expert-Tailored Solutions
See step-by-step solutions with expert insights and AI powered tools for academic success
Step: 2

Step: 3
Ace Your Homework with AI
Get the answers you need in no time with our AI-driven, step-by-step assistance
Get Started
General Aviation Marketing And Management
Authors: C. Daniel Prather
3rd Edition
9781575243016