

Answered step by step
Verified Expert Solution
Question
1 Approved Answer
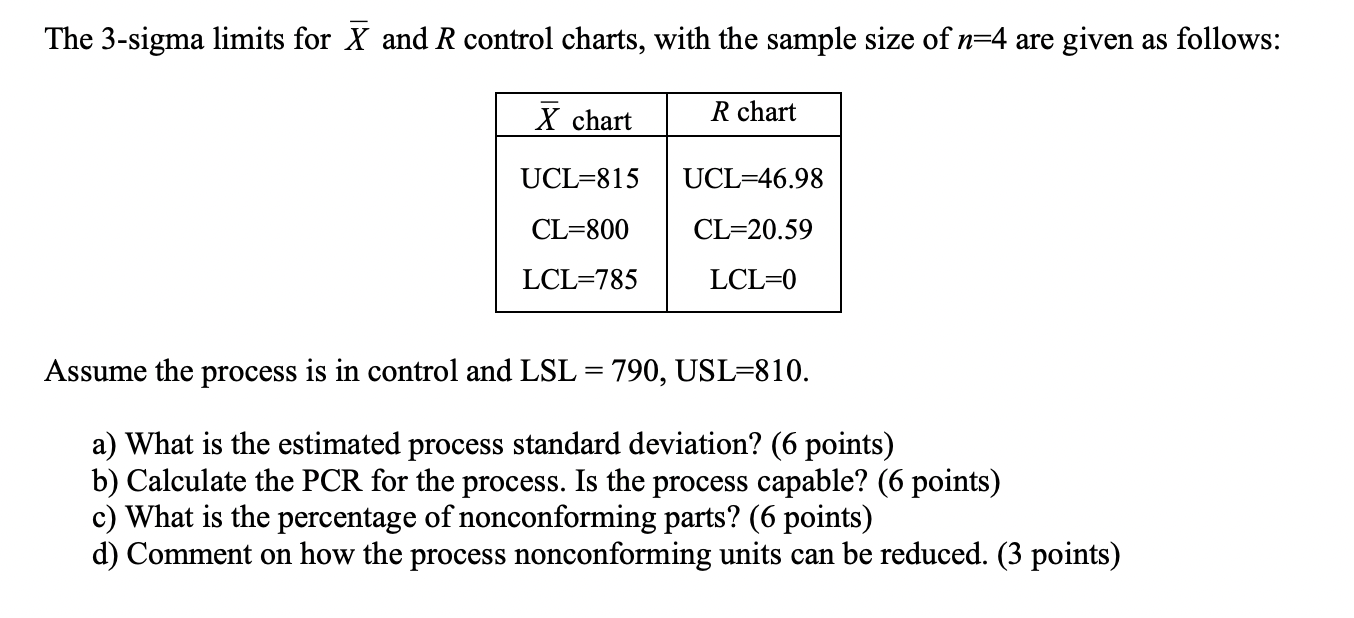
The 3-sigtna limits for X and R control charts, with the sample size of n=4 are given as follows: UCL=815 UCL=46.98 CL=800 CL=20.59 LCL=785 LCL=0

Step by Step Solution
There are 3 Steps involved in it
Step: 1

Get Instant Access to Expert-Tailored Solutions
See step-by-step solutions with expert insights and AI powered tools for academic success
Step: 2

Step: 3
Ace Your Homework with AI
Get the answers you need in no time with our AI-driven, step-by-step assistance
Get Started
Reading, Writing, And Proving A Closer Look At Mathematics
Authors: Ulrich Daepp, Pamela Gorkin
2nd Edition
1441994793, 9781441994790