

Question
The above shows the output after applying a linear regression model into this dataset : https://drive.google.com/file/d/1XqsEnwsLQ7QN1Q4aD30DIJePmiljr1tL/view?usp=share_link Using R programming , i am required to perform
The above shows the output after applying a linear regression model into this dataset : https://drive.google.com/file/d/1XqsEnwsLQ7QN1Q4aD30DIJePmiljr1tL/view?usp=share_link
Using R programming, i am required to perform exploratory data analysis and pre-process the data. It's also required to define the goal that can be applied to the dataset and perform some data pre-processing, e.g., perform conversion to ensure the variable is in the desired type, treating missing values, or remove irrelevant variables etc.
Plus, it is also required to : Using R programming, depending on the goal of the project that have been defined, please build two machine learning models to apply to the data. Choose two out of the following four machine learning models (i.e. clustering, classification, regression, or association rules analysis)
The dataset: https://drive.google.com/file/d/1XqsEnwsLQ7QN1Q4aD30DIJePmiljr1tL/view?usp=share_link
Retrieved from: https://data.world/data-society/air-traffic-passenger-data
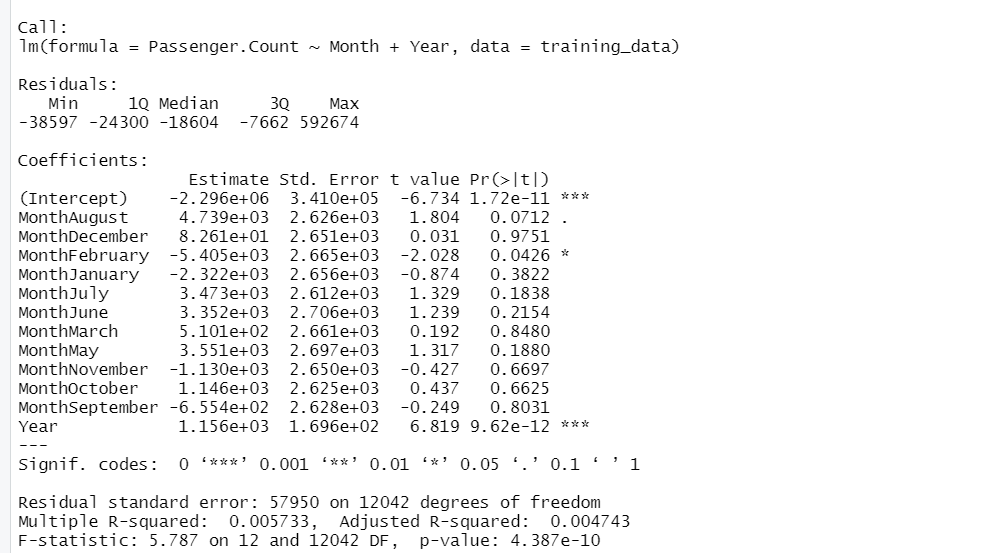
Then, i used the following coding then i get the output as the above picture. But then, it seems like the model is not a good fit to the dataset. The model summary shows that the coefficient of determination (R-squared) is 0.005733, which is a measure of how well the model fits the data. This value indicates that the model is not a good fit for the data. Is the model doesn't fit well with the data? What can be done to fix this problem? Is there a need of changing to other type of machine learning model? Please investigate more on the model and the dataset! And the variables that are needed to be considered.
Please fix this problem and i use the following coding so please fix this code using R programming!
# Load data
data
# Inspect data
str(data)
head(data)
# Check for missing values
sum(is.na(data))
# Summary statistics
summary(data)
# Visualize data
library(ggplot2)
ggplot(data, aes(x = Month, y = Passengers, color = Year)) +
geom_line() +
ggtitle("Air Traffic Passenger Data")
# Splitting data into training and testing sets
library(caTools)
set.seed(123)
split
train_data
test_data
# Model 1: Linear Regression
library(lm)
model1
summary(model1)
Step by Step Solution
There are 3 Steps involved in it
Step: 1

Get Instant Access to Expert-Tailored Solutions
See step-by-step solutions with expert insights and AI powered tools for academic success
Step: 2

Step: 3
Ace Your Homework with AI
Get the answers you need in no time with our AI-driven, step-by-step assistance
Get Started
Excel As Your Database
Authors: Paul Cornell
1st Edition
1590597516, 978-1590597514