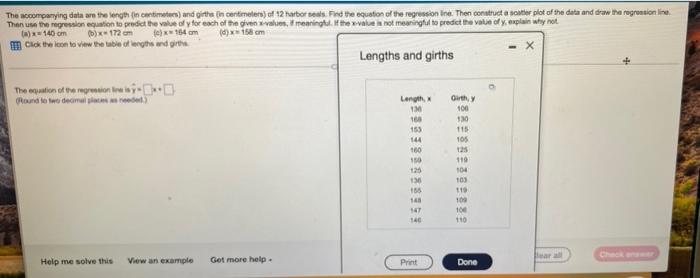
The accompanying data are the length in times and girth in centimeters) of 12 harbor. Find the equation of the regression in. Then construct a solutie plot of the data and drew the regression line Then the regression in to predict the value ofy for each of the given values, meaning the value is not meaningful to predict the value of explain why not x 140 cm (172.om 154cm d) 158 cm m Click then to view the be of lengths with Lengths and girths The gation of the printr- Length Guth, 100 160 130 115 144 105 180 150 110 125 104 130 103 135 110 14 100 17 100 140 110 Help me solve this Cha View an example Get more help Print Done The accompanying data are the length in centimeters) and other in centimeters) of 12 harbor. Find oution of the repression in the construct a cutter plot of the data and draw the pression line Then use the regression equation to predict the value y for each of the given values, meaningful the value is not meaningful to predict the value of y, explain why not (w) x 140 cm x 172 cm (c) 164 cm (d)x158 cm Click the icon to view the table of lengths and girthe X Lengths and girths x 1 The equation of the growsion line is yD (Round to two decimal places needed) Length, 130 160 153 144 160 150 125 130 156 148 147 148 Girth, y 106 130 118 105 125 110 104 103 110 109 100 110 The accompanying data are the length in times and girth in centimeters) of 12 harbor. Find the equation of the regression in. Then construct a solutie plot of the data and drew the regression line Then the regression in to predict the value ofy for each of the given values, meaning the value is not meaningful to predict the value of explain why not x 140 cm (172.om 154cm d) 158 cm m Click then to view the be of lengths with Lengths and girths The gation of the printr- Length Guth, 100 160 130 115 144 105 180 150 110 125 104 130 103 135 110 14 100 17 100 140 110 Help me solve this Cha View an example Get more help Print Done The accompanying data are the length in centimeters) and other in centimeters) of 12 harbor. Find oution of the repression in the construct a cutter plot of the data and draw the pression line Then use the regression equation to predict the value y for each of the given values, meaningful the value is not meaningful to predict the value of y, explain why not (w) x 140 cm x 172 cm (c) 164 cm (d)x158 cm Click the icon to view the table of lengths and girthe X Lengths and girths x 1 The equation of the growsion line is yD (Round to two decimal places needed) Length, 130 160 153 144 160 150 125 130 156 148 147 148 Girth, y 106 130 118 105 125 110 104 103 110 109 100 110


