Answered step by step
Verified Expert Solution
Question
1 Approved Answer
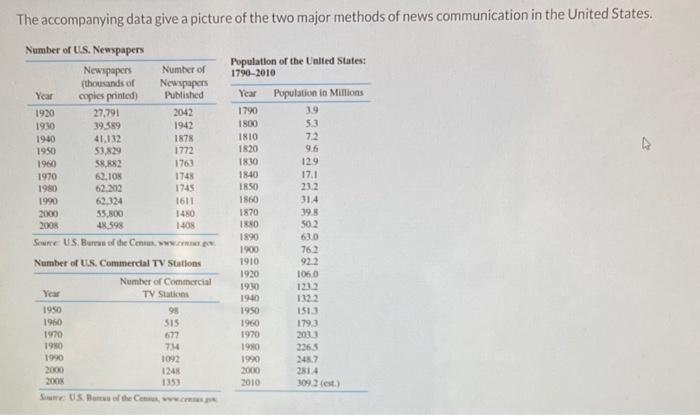
The accompanying data give a picture of the two major methods of news communication in the United States. Number of U.S. Newspapers Newspapers (thousands


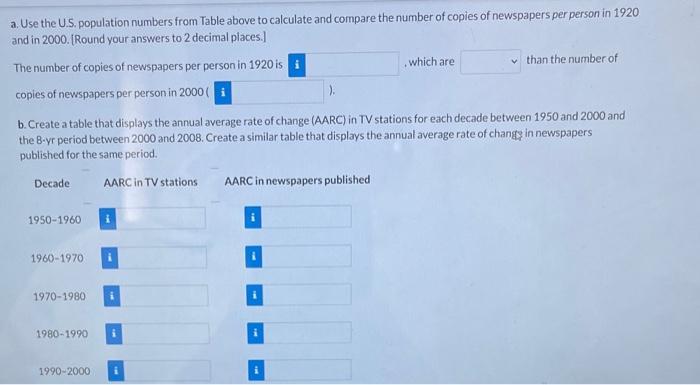
The accompanying data give a picture of the two major methods of news communication in the United States. Number of U.S. Newspapers Newspapers (thousands of copies printed) Year 1920 1930 1940 1950 1960 1970 27,791 39,589 Number of Newspapers Published 2042 1942 41,132 53,829 58,882 62,108 1980 62.202 1990 62,324 2000 55,800 2008 48,598 Source: US. Burras of the Cenas, www.ca.go 1878 1772 1763 1748 1745 1611 1480 1408 Number of US. Commercial TV Stations Number of Commercial TV Stations Year 1950 1960 1970 1980 1990 2000 2008 Some U.S. Bass of the Census, www.com.p 98 515 677 734 1092 1248 1353 Population of the United States: 1790-2010 Year 1790 1800 1810 1820 1830 1840 1850 1860 1870 1880 1890 1900 1910 1920 1930 1940 1950 1960 1970 1980 1990 2000 2010 Population in Millions 3.9 5.3 7.2 9.6 12.9 17.1 23.2 31.4 39.8 50.2 63.0 76.2 92.2 106,0 123.2 132.2 151.3 179.3 203.3 226.5 248.7 281.4 309.2(est.) a. Use the U.S. population numbers from Table above to calculate and compare the number of copies of newspapers per person in 1920 and in 2000. [Round your answers to 2 decimal places.] The number of copies of newspapers per person in 1920 is i copies of newspapers per person in 2000 ( Decade ). b. Create a table that displays the annual average rate of change (AARC) in TV stations for each decade between 1950 and 2000 and the B-yr period between 2000 and 2008. Create a similar table that displays the annual average rate of change in newspapers published for the same period. AARC in TV stations 1950-1960 1960-1970) 1970-1980 1980-1990 1990-2000 i which are AARC in newspapers published than the number of 2000-2008 MI IM c. If new TV stations continue to come into existence at the same rate as from 2000 to 2008, how many would there be in the year 2010? [Round your answer to the nearest integer.] TV stations
Step by Step Solution
★★★★★
3.42 Rating (155 Votes )
There are 3 Steps involved in it
Step: 1
The images you have provided show a collection of data in two tables one for the number of US newspapers and the number of copies printed and one for ...
Get Instant Access to Expert-Tailored Solutions
See step-by-step solutions with expert insights and AI powered tools for academic success
Step: 2

Step: 3

Ace Your Homework with AI
Get the answers you need in no time with our AI-driven, step-by-step assistance
Get Started


