

Question
The accompanying data represent the miles per gallon of a random sample of cars with a?three-cylinder, 1.0 liter engine. ?(a) Compute the?z-score corresponding to the
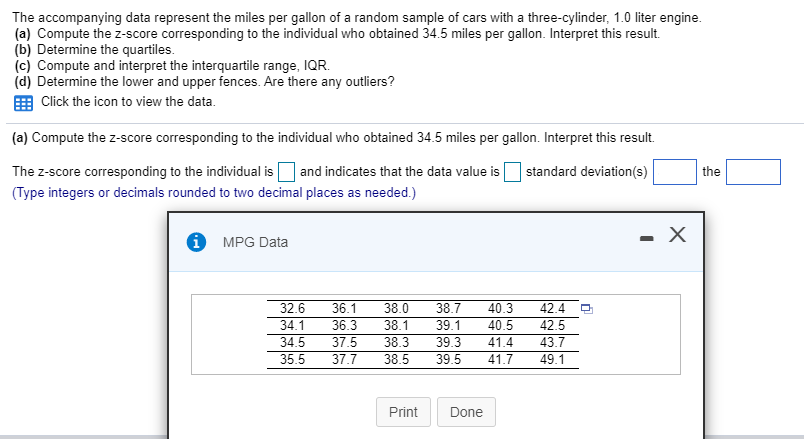
The accompanying data represent the miles per gallon of a random sample of cars with a?three-cylinder, 1.0 liter engine.
?(a) Compute the?z-score corresponding to the individual who obtained 34.5 miles per gallon. Interpret this result.
The?z-score corresponding to the individual is ____ and indicates that the data value is ____ standard?deviation(s) ____ the ____.
?(b) Determine the quartiles.
?(c) Compute and interpret the interquartile?range, IQR.
?(d) Determine the lower and upper fences. Are there any?outliers?
Step by Step Solution
There are 3 Steps involved in it
Step: 1

Get Instant Access to Expert-Tailored Solutions
See step-by-step solutions with expert insights and AI powered tools for academic success
Step: 2

Step: 3
Ace Your Homework with AI
Get the answers you need in no time with our AI-driven, step-by-step assistance
Get Started
Precalculus
Authors: Michael Sullivan
10th Global Edition
1292121772, 1292121777, 978-1292121772