The accompanying data shows the fossil fuels preduction, fossil fuels consumption, and total energy consumption in quadrillions of BTUs of a certain region for the
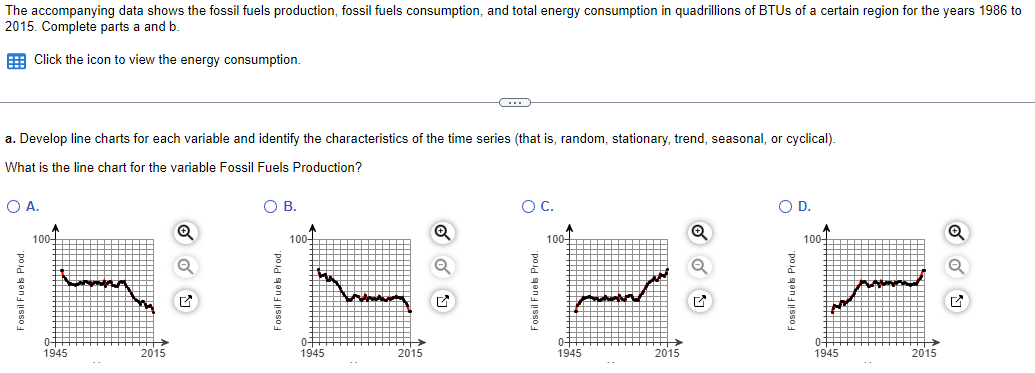
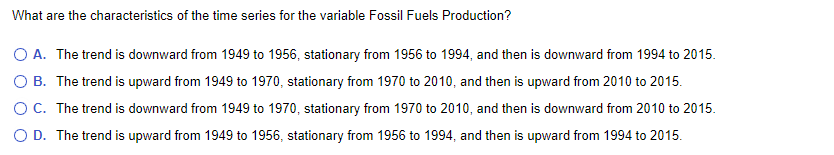
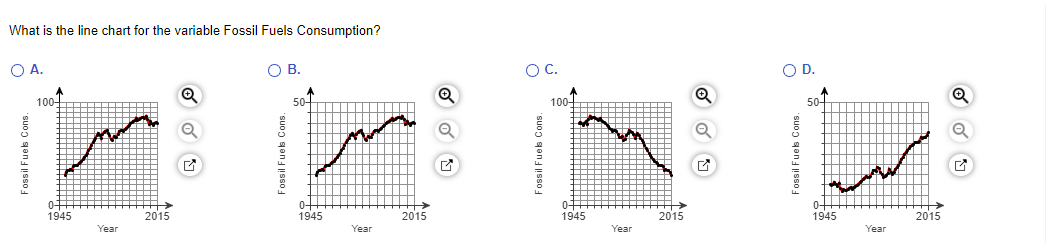
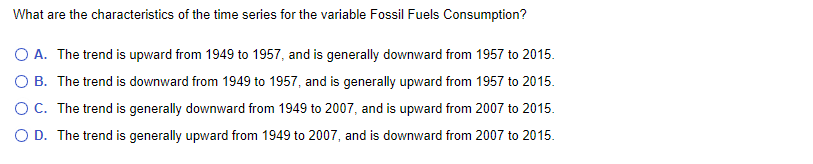
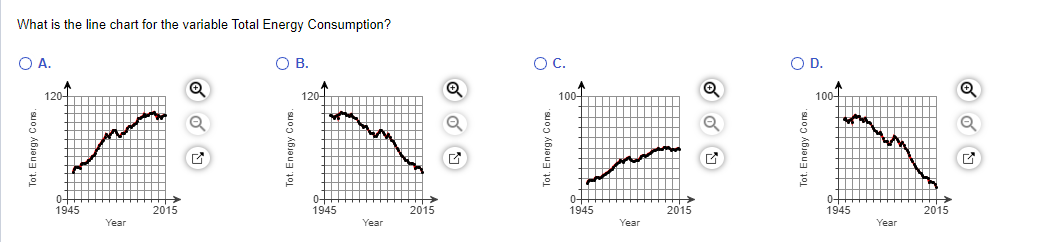
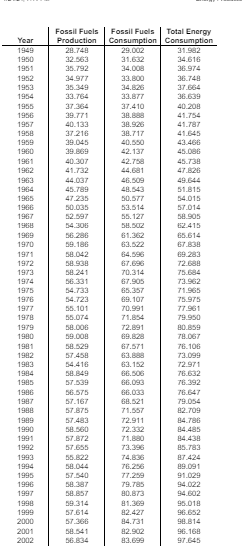
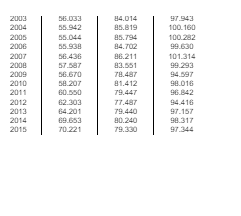
The accompanying data shows the fossil fuels preduction, fossil fuels consumption, and total energy consumption in quadrillions of BTUs of a certain region for the years 1986 to 2015. Complete parts a and b. EFR Click the icon to view the energy consumption. a. Develop line charts for each variable and identify the characteristics of the time series (that is, random, stationary, trend, seasonal, or cyclical). What is the line chart for the variable Fossil Fuels Production? O A O B. O cC. O D. 100} Q Fossil Fuel Prod. Fossil Fuek Prod. Fossil Fuel Prod. Fossil Fuek Prod. What ara the characteristics of the time series for the variable Fossil Fuels Production? () A. The trend is downward from 1949 to 1956, stationary from 1956 to 1994, and then is downward from 19594 to 2015. () B. The trend is upward from 1949 to 1970, stationary from 1970 to 2010, and then is upward from 2010 to 2015 () C. The trend is downward from 1949 to 1970, stationary from 1970 to 2010, and then is downward from 2010 to 2015. () D. The trend is upward from 1949 to 1956, stationary from 1956 to 1994, and then is upward from 1994 to 2015. What is the line chart for the variable Fossil Fuels Consumption? O A. O B. O C. OD. 100- 501 100- 50-T Fossil Fuels Cons. Fossil Fuels Cons. Fossil Fuels Cons. Fossil Fuels Cons. 2015 Off 1945 1945 2015 1945 2015 1945 2015 Year Year Year YearWhat are the characteristics of the time series for the variable Fossil Fuels Consumption? O A. The trend is upward from 1949 to 1957, and is generally downward from 1957 to 2015. O B. The trend is downward from 1949 to 1957, and is generally upward from 1957 to 2015. O C. The trend is generally downward from 1949 to 2007, and is upward from 2007 to 2015. O D. The trend is generally upward from 1949 to 2007, and is downward from 2007 to 2015.What is the line chart for the variable Total Energy Consumption? O A. O B. OC. OD. 1207 O 120- 100- 100- Tot. Energy Cons. Tot. Energy Cons. Tot. Energy Cons Tot. Energy Cons. off 1945 2015 1945 2015 1945 2015 1945 2015 Year Year Year YearWhat are the characteristics of the time series for the variable Total Energy Consumption? () A. The trend is upward from 1949 to 1957, and then is generally downward from 1957 to 2015. () B. The trend is generally downward from 1949 to 2007, and then is upward from 2007 to 2015. () C. The trend is generally upward from 1949 to 2007, and then iz downward from 2007 to 2015 () D. The trend is downward from 1949 to 1957, and then is generally upward from 1957 to 2015 b. In forecasting the future, should all or only a portion of the data be used? ) A. Whean the data have different characteristics in different periods, using all of the data would provide the best estimate for the future. () B. When the data have different characteristics in different periods, using the recent data only would provide the best estimate for the future. () C. The most recent data should be used no matter the characteristics of the data. () D. All of the data should be used no matter the characteristics of the data. Fossil Fuels Fossil Fuels Total Energy Year Production Consumption Consumption 1949 28 748 29.002 31.982 1950 31.632 34.616 1951 36.792 34.008 34974 1952 34 9FT 33.800 30 748 1953 35.349 34.LEG 1954 23.764 361639 1958 37.264 37.410 40.208 1956 39.771 41.754 1957 40-133 38.920 41 787 1958 37.216 41.645 1959 39.045 40.BSO 43.406 1900 39 809 42. 137 45.086 1961 40ROT 42.783 45-738 41.732 44.081 47 826 1903 44 037 46.809 491644 1964 45-789 48.843 51.815 1965 47.235 54.015 1906 60.035 53.514 67 014 1967 58.127 58.905 54.306 SH.BOR. 12 415 1909 61.362 65.614 1970 59-186 67 838 1971 58.042 64.890 69.283 1972 58.904 72 048 58.241 70.314 751084 1974 54.231 67.905 73.962 1975 54.733 71.965 1976 54.723 69. 107 75.975 1977 56-101 70.991 77 901 56 074 71.854 79.950 1979 72.891 80.859 1980 58008 THOUT 1981 58.629 67.671 76-106 1983 54.410 63. 152 72.971 58.849 761632 1985 17.839 76.392 THREAT 1987 68.621 791054 1948 71.857 12 709 1989 67.483 72.911 84 786 1990 72.132 84.485 1991 57 872 71.8.90 84.438 1992 67 055 73.386 85.783 56.622 47.424 1994 58.044 89 09 1 1995 67.640 TY.259 91 029 1990 79.785 94 022 1997 BHLEST 94.602 59.314 81.209 90 018 1999 57.614 42.427 901652 2000 84.731 98 814 2001 58.641 42.902 90.168 2002 43.099 971645\f
Step by Step Solution
There are 3 Steps involved in it
Step: 1
Get Instant Access to Expert-Tailored Solutions
See step-by-step solutions with expert insights and AI powered tools for academic success
Step: 2
Step: 3
Ace Your Homework with AI
Get the answers you need in no time with our AI-driven, step-by-step assistance