Answered step by step
Verified Expert Solution
Question
1 Approved Answer
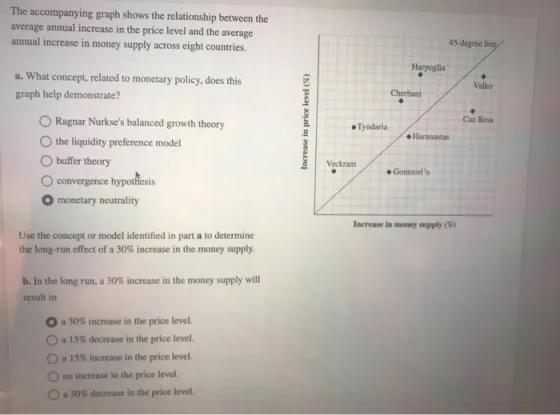
The accompanying graph shows the relationship between the average annual increase in the price level and the average annual increase in money supply across

The accompanying graph shows the relationship between the average annual increase in the price level and the average annual increase in money supply across eight countries. a. What concept, related to monetary policy, does this graph help demonstrate? Ragnar Nurkse's balanced growth theory the liquidity preference model Obuffer theory convergence hypothesis monetary neutrality Lise the concept or model identified in part a to determine the long-run effect of a 30% increase in the money supply. b. In the long run, a 30% increase in the money supply will result in a 30% increase in the price level. O15% decrease in the price level. a 15% increase in the price level. to increase in the price level. O 30% decrease in the price level. Increase in price level (5) Veckram Tyndaria Harpoglia Cherhani Harnest God's Increase in money supply (5) Valko Cat Besa
Step by Step Solution
There are 3 Steps involved in it
Step: 1
The detailed ...
Get Instant Access to Expert-Tailored Solutions
See step-by-step solutions with expert insights and AI powered tools for academic success
Step: 2

Step: 3

Ace Your Homework with AI
Get the answers you need in no time with our AI-driven, step-by-step assistance
Get Started


