Answered step by step
Verified Expert Solution
Question
1 Approved Answer
The accompanying Major League Baseball data provide data for one season. Complete parts a through c. Click the icon to view the Major League


![Won IRuns I Hits 713 7381 613 8211 685 4.19 752 467 5221 585/ 81] 1147 801 5141 794 646 770 751 719 611 676 681 6671 750 782](https://dsd5zvtm8ll6.cloudfront.net/si.experts.images/questions/2022/01/61f375d13d45c_1643345360022.jpg)
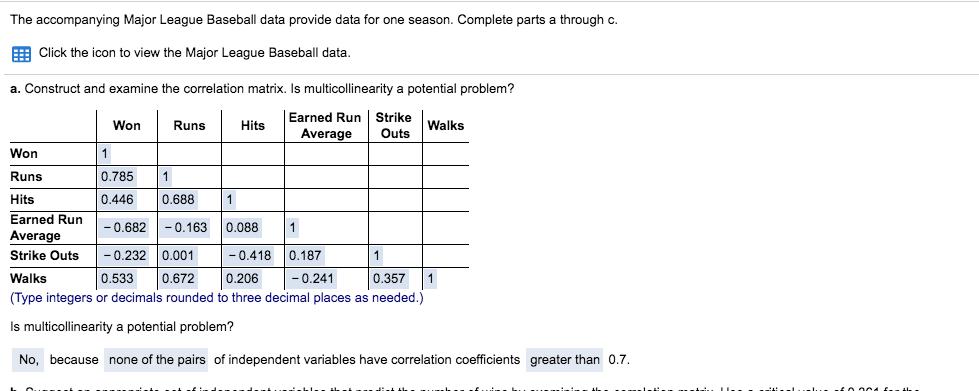
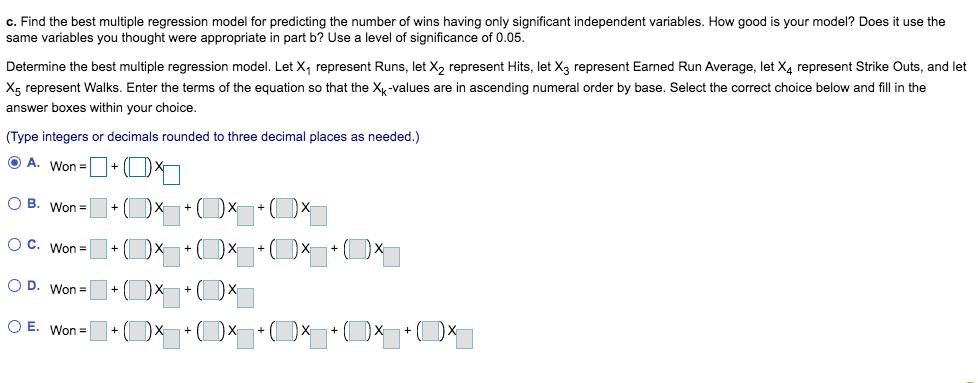
The accompanying Major League Baseball data provide data for one season. Complete parts a through c. Click the icon to view the Major League Baseball data. a. Construct and examine the correlation matrix. Is multicollinearity a potential problem? Earned Run Strike Average Outs Won Runs Hits Earned Run Average Strike Outs Won Runs 1 0.785 1 0.446 0.688 1 Hits -0.682 - 0.163 1 0.088 -0.232 0.001 -0.418 0.206 Walks 0.533 0.672 0.357 1 (Type integers or decimals rounded to three decimal places as needed.) Is multicollinearity a potential problem? No, because none of the pairs of independent variables have correlation coefficients greater than 0.7. 0.187 -0.241 Walks 1 cd f b. Suggest an appropriate set of independent variables that predict the number of wins by examining the correlation matrix. Use a critical value of 0.361 for the correlation coefficient. Select all that apply. FV A. Runs B. Walks C. Hits D. Earned Run Average E. Strike Outs c. Find the best multiple regression model for predicting the number of wins having only significant independent variables. How good is your model? Does it use the same variables you thought were appropriate in part b? Use a level of significance of 0.05. Determine the best multiple regression model. Let X represent Runs, let X represent Hits, let X3 represent Earned Run Average, let X4 represent Strike Outs, and let X5 represent Walks. Enter the terms of the equation so that the X-values are in ascending numeral order by base. Select the correct choice below and fill in the answer boxes within your choice. (Type integers or decimals rounded to three decimal places as needed.) A. Won+ OB. Won= OC. Won= OD. Won= O E. Won= + + X + 1 + + + x X +(x Won 65 91 66 89 75 88 00 91 69 83 81 80 76 67 80 80 77 94 79 ain 95 o 81 97 57 90 92 61 86 96 90 85 69 Runs 713 738 613 821 685 752 794 646 770 751 719 611 676 681 667 750 782 656 853 663 772 587 665 697 513 736 800 787 755 655 Hits 1366 1411 1440 1511 1414 1467 1515 1362 1452 1515 1403 1348 1534 1363 1368 1471 1521 1361 1485 1396 1451 1303 1338 1411 1274 1456 1343 1556 1364 1355 Earned Run Average 4.81 3.56 4.59 4.19 4.18 4.09 4.01 4.3 4.14 4.3 4.08 4.09 4.97 4.04 4.01 4.58 3.95 3.7 4.06 3.56 3.67 5 3.39 3.36 3.93 3.57 3.78 3.93 4.22 4.13 Strike Outs 1528 1140 1056 1140 1235 922 1218 1184 1274 1147 1375 1025 905 1070 1184 1215 967 1095 1136 1061 1064 1207 1183 1099 1184 1027 1294 986 1164 1222 Walks 589 634 424 587 479 467 522 545 585 546 514 415 471 466 533 546 559 502 662 527 560 463 538 487 459 541 672 511 471 503
Step by Step Solution
★★★★★
3.45 Rating (155 Votes )
There are 3 Steps involved in it
Step: 1
a We input the data set in MS Excel and use the Correlation option under Data ...
Get Instant Access to Expert-Tailored Solutions
See step-by-step solutions with expert insights and AI powered tools for academic success
Step: 2

Step: 3

Ace Your Homework with AI
Get the answers you need in no time with our AI-driven, step-by-step assistance
Get Started


