Question
The accompanying table shows a portion of the average SAT math score (Math), the average SAT writing score (Writing), the number of test takers (Test
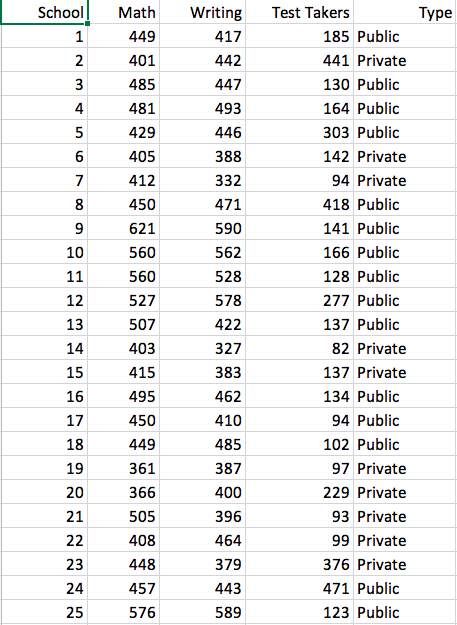
The accompanying table shows a portion of the average SAT math score (Math), the average SAT writing score (Writing), the number of test takers (Test Taker), and whether the school is a private or public school (Type) for 25 high schools in a major metropolitan area.
| School | Math | Writing | Test Takers | Type |
| 1 | 449 | 417 | 185 | Public |
| 2 | 401 | 442 | 441 | Private |
| 25 | 576 | 589 | 123 | Public |

1. Construct a bubble plot that shows math score on the x-axis, writing score on the y-axis, and number of test takers as the size of the bubble. Given the bubble plot, which statement best describes the relationship between math scores and writing scores?
a.Math scores and writing scores have no relationship.
b.Math scores and writing scores have a positive linear relationship.
c.Math scores and writing scores have a negative linear relationship.
d.Math scores and writing scores have a non-linear (U-shaped) relationship.
2.Given the bubble plot, which statement best describes the relationship between math scores and the size of the school (the number of test takers)?
a.Math scores and the size of the school have no apparent relationship.
b.Larger schools have higher test scores.
c.Smaller schools have higher test scores.
d.Math scores and the size of the school have an inverted U-shaped relationship.
b. Construct a scatterplot that shows math score on the x-axis and writing score on the y-axis. Use different colors or symbols to show whether the high school is a private or a public school. Which of the following statements best describes the relationship between math scores, writing scores, and type of school?
a.Public schools tend to have higher math and writing scores.
b.Private schools tend to have higher math and writing scores.
c.There is no relationship between type of school and test scores.
d.Both types of schools show a negative relationship between math and writing scores.
Type School 1 2 3 4 5 6 Math 449 401 485 481 429 405 412 450 621 560 7 8 Writing 417 442 447 493 446 388 332 471 590 562 528 578 422 327 9 560 527 Test Takers 185 Public 441 Private 130 Public 164 Public 303 Public 142 Private 94 Private 418 Public 141 Public 166 Public 128 Public 277 Public 137 Public 82 Private 137 Private 134 Public 94 Public 102 Public 97 Private 229 Private 93 Private 99 Private 376 Private 471 Public 123 Public 10 11 12 13 14 15 16 17 18 507 403 415 383 495 19 20 21 22 23 24 25 450 449 361 366 505 408 448 457 576 462 410 485 387 400 396 464 379 443 589Step by Step Solution
There are 3 Steps involved in it
Step: 1

Get Instant Access to Expert-Tailored Solutions
See step-by-step solutions with expert insights and AI powered tools for academic success
Step: 2

Step: 3

Ace Your Homework with AI
Get the answers you need in no time with our AI-driven, step-by-step assistance
Get Started


