

Answered step by step
Verified Expert Solution
Question
1 Approved Answer
. The accompanying toble shows a portion of quarterty data for teat personal consumption (Consumption in $) and reai personat disposable income (income in 51
. 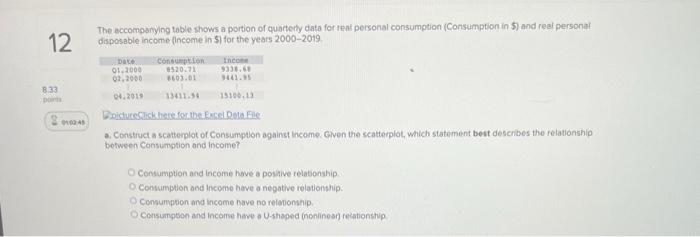
The accompanying toble shows a portion of quarterty data for teat personal consumption (Consumption in \$) and reai personat disposable income (income in 51 for the years 2000-2019 a. Construct a scatemplot of Consumpton against lincome. Given the scatterplot, which statement best describes the felationship between Cansumption ond income? Consumption and income hove a positive relationship. Consumption and income have a negative relationship? Consumphon and income nave no relationsip. Consumqteon and incorre hawe a U-shaped (noninesi) recationstip The accompanying toble shows a portion of quarterty data for teat personal consumption (Consumption in \$) and reai personat disposable income (income in 51 for the years 2000-2019 a. Construct a scatemplot of Consumpton against lincome. Given the scatterplot, which statement best describes the felationship between Cansumption ond income? Consumption and income hove a positive relationship. Consumption and income have a negative relationship? Consumphon and income nave no relationsip. Consumqteon and incorre hawe a U-shaped (noninesi) recationstip Step by Step Solution
There are 3 Steps involved in it
Step: 1

Get Instant Access to Expert-Tailored Solutions
See step-by-step solutions with expert insights and AI powered tools for academic success
Step: 2

Step: 3
Ace Your Homework with AI
Get the answers you need in no time with our AI-driven, step-by-step assistance
Get Started
The Fiscal Impact Handbook
Authors: David Listokin
1st Edition
1138535672, 978-1138535671