

Question
The actual question(s): Identify spikes (outliers) in the data where extreme sales values occur and correlate these spikes with actual calendar dates in 2002 or


The actual question(s):
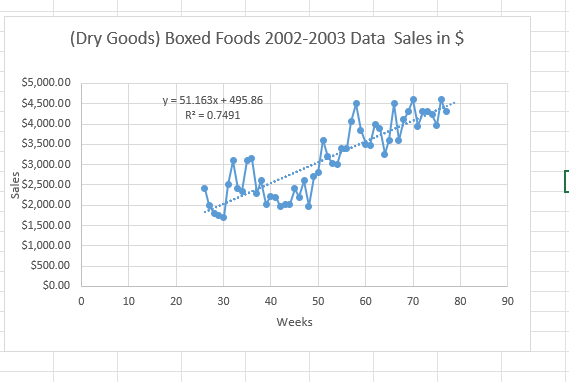
- Identify spikes (outliers) in the data where extreme sales values occur and correlate these spikes with actual calendar dates in 2002 or 2003 and with holidays or special events that may occur during these periods.
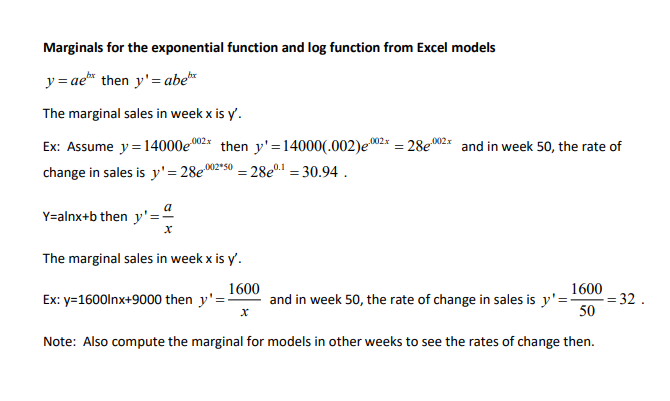
- What are the marginal sales (derivatives, i.e., rate of change) for various weeks throughout the data set for this department using each model? What are marginal sales for each model? d. Sales for each model for the weeks 79, 81 and 83 which is six weeks after the data set ends. Rates of change (marginals) for each model at weeks 79, 81 and 83. e. Remove appropriate outliers as you deem necessary and rerun the least squares models. What are the marginal sales for each new model and discuss R2 changes. f. If new models with outliers were removed, what would be the predictions of sales and marginals at weeks 79, 81 and 83?
- Based on all models run, which model best predicts future trends. Compare models and explain overall the best to use in representing the overall data pattern and why. b. Based on the model selected, what type of seasonal adjustments, if any, would be required to meet customer needs?
Example of writing:
. Note that WalMart's fiscal year starts the first week of February. This means that when analyzing the data, week 26 is actually week 30 (26+4 weeks for January) in 2002 or the end of July 2002. Also, week 52 is actually week 4 (52+4 weeks for January 2002 minus 52 weeks for 2002) in 2003 or the end of January 2003. As an example, the spike in sales (revenue) at week 75 occurs in week 27 (75+4 weeks for January 2002 minus 52 weeks for 2002) in 2003 or the first week in July 2003. This corresponds to sales for the July 4th holiday when people are buying barbecue related items. Even though the acquired data is from 2002-2003, the data analyses are relevant for data acquired at other time periods.
Example of problems:
Step by Step Solution
There are 3 Steps involved in it
Step: 1

Get Instant Access to Expert-Tailored Solutions
See step-by-step solutions with expert insights and AI powered tools for academic success
Step: 2

Step: 3
Ace Your Homework with AI
Get the answers you need in no time with our AI-driven, step-by-step assistance
Get Started
Calculus Single Variable
Authors: Brian E Blank, Steven G Krantz
2nd Edition
1118136012, 9781118136010