

Question
The actual returns of the S&P since 1928 are in the attached file. The Assignment Your team works at a financial advisory firm and is
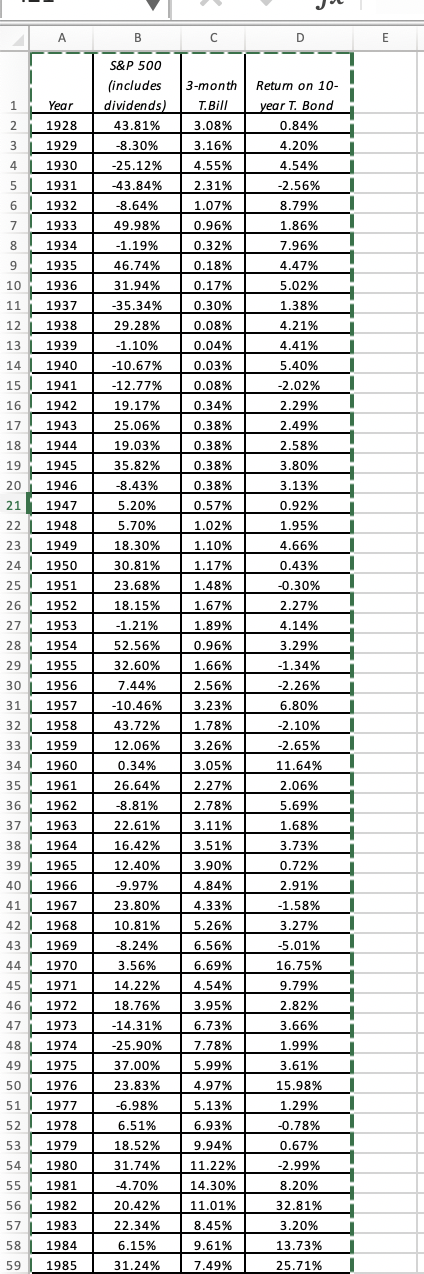
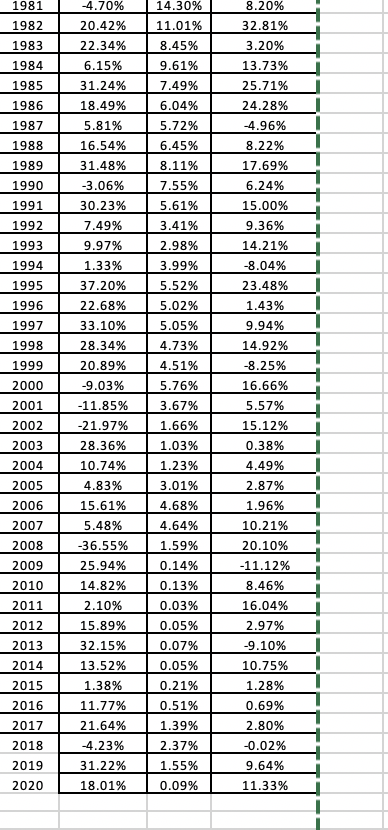
The actual returns of the S&P since 1928 are in the attached file.
The Assignment
Your team works at a financial advisory firm and is asked to work with a client, Ms Christie, who has retired and has 400K in liquid assets.
To maintain a semblance of her prior lifestyle she needs to draw down 50K per year to complement social security and other pension payments.
a) Based on actual data (use the random function to select different starting years), determine the average number of years she can continue to draw down 50K before she runs out of money.
b) Second, since your client understands distribution (she took this course) and comes from a family of septagenarians, she wants to know how much she can draw down if she expects to live to 78. She is 65 now.
c) finally, any other advice you would like to offer
Using excel to solve thanks a lot.
A B D E S&P 500 (includes dividends) 43.81% 3-month T. Bill 1 Year Return on 10- year T. Bond 0.84% 2 3.08% 1928 1929 3 -8.30% 4.20% 3.16% 4.55% 4 1930 -25.12% -43.84% 5 1931 2.31% 1.07% 6 1932 -8.64% 4.54% -2.56% 8.79% 1.86% 7.96% 7 1933 49.98% -1.19% 0.96% 0.32% 8 1934 1935 9 46.74% 0.18% 4.47% 10 1936 0.17% 5.02% 11 1937 12 1938 0.30% 0.08% 0.04% 0.03% 1.38% 4.21% 4.41% 13 31.94% -35.34% 29.28% -1.10% -10.67% -12.77% 19.17% 25.06% 1939 14 1940 1941 15 16 17 5.40% -2.02% 2.29% 0.08% 0.34% 0.38% 1942 1943 18 1944 19.03% 2.49% 2.58% 3.80% 3.13% 19 0.38% 0.38% 0.38% 1945 1946 20 21 1947 35.82% -8.43% 5.20% 5.70% % 18.30% 0.57% 22 1948 1.02% 0.92% 1.95% 4.66% 0.43% 23 1949 24 1950 30.81% 23.68% 25 1951 1.10% 1.17% 1.48% 1.67% 1.89% -0.30% 26 1952 18.15% -1.21% 27 28 1953 1954 1955 1956 1957 29 52.56% 32.60% 7.44% 2.27% 4.14% 3.29% -1.34% -2.26% 0.96% 1.66% 2.56% 3.23% 30 31 32 1958 1.78% 3.26% 33 1959 -10.46% 43.72% 12.06% 0.34% 26.64% -8.81% 34 1960 3.05% 2.27% 6.80% -2.10% -2.65% 11.64% 2.06% 5.69% 1.68% 35 1961 1962 36 37 38 1963 2.78% 3.11% 3.51% 3.90% 22.61% 16.42% 12.40% 1964 3.73% 39 1965 40 4.84% 1966 1967 -9.97% 23.80% 0.72% 2.91% -1.58% 3.27% % 41 4.33% 5.26% 42 10.81% 1968 1969 43 6.56% -5.01% 44 1970 -8.24% 3.56% 14.22% 18.76% 16.75% 9.79% 45 1971 6.69% 4.54% 3.95% 6.73% 46 1972 2.82% 3.66% 47 1973 48 7.78% 1.99% 1974 1975 49 5.99% 4.97% 1976 -14.31% -25.90% 37.00% 23.83% -6.98% 6.51% 18.52% 50 51 3.61% 15.98% 1.29% -0.78% 1977 52 1978 0.67% 53 54 1979 1980 31.74% -2.99% 55 1981 -4.70% 5.13% 6.93% 9.94% 11.22% 14.30% 11.01% 8.45% 9.61% 7.49% 8.20% 32.81% 56 1982 1983 57 58 20.42% 22.34% 6.15% 1984 3.20% 13.73% 25.71% 59 1985 31.24% -4.70% 14.30% 8.20% 1981 1982 11.01% 32.81% 20.42% 22.34% 1983 8.45% 3.20% 13.73% 1984 6.15% 9.61% 1985 31.24% 1986 18.49% 5.81% 7.49% 6.04% 5.72% 25.71% 24.28% -4.96% 1987 1988 16.54% 6.45% 1989 31.48% 8.11% 1990 -3.06% 7.55% 8.22% 17.69% 6.24% 15.00% 9.36% 1991 5.61% 30.23% 7.49% 1992 3.41% 9.97% 1.33% 2.98% 3.99% 1993 1994 1995 1996 14.21% -8.04% 23.48% 1.43% 5.52% 5.02% 1997 1998 37.20% 22.68% 33.10% 28.34% 20.89% -9.03% 5.05% 4.73% 9.94% 14.92% -8.25% 16.66% 1999 2000 4.51% 5.76% 3.67% 1.66% 2001 -11.85% -21.97% 5.57% 15.12% 2002 2003 28.36% 1.03% 0.38% 2004 10.74% 4.49% 1.23% 3.01% 2005 4.83% 2.87% 2006 15.61% 4.68% 1.96% 2007 4.64% 5.48% -36.55% 2008 1.59% 0.14% 2009 25.94% 10.21% 20.10% -11.12% 8.46% 16.04% 2.97% 14.82% 0.13% 0.03% 0.05% 2010 2011 2012 2013 2014 2015 2.10% 15.89% 32.15% 13.52% 1.38% 0.07% -9.10% 10.75% 0.05% 0.21% 1.28% 2016 0.69% 2017 2.80% 11.77% 21.64% -4.23% 31.22% 0.51% 1.39% 2.37% 1.55% 2018 2019 -0.02% 9.64% 11.33% 2020 18.01% 0.09% A B D E S&P 500 (includes dividends) 43.81% 3-month T. Bill 1 Year Return on 10- year T. Bond 0.84% 2 3.08% 1928 1929 3 -8.30% 4.20% 3.16% 4.55% 4 1930 -25.12% -43.84% 5 1931 2.31% 1.07% 6 1932 -8.64% 4.54% -2.56% 8.79% 1.86% 7.96% 7 1933 49.98% -1.19% 0.96% 0.32% 8 1934 1935 9 46.74% 0.18% 4.47% 10 1936 0.17% 5.02% 11 1937 12 1938 0.30% 0.08% 0.04% 0.03% 1.38% 4.21% 4.41% 13 31.94% -35.34% 29.28% -1.10% -10.67% -12.77% 19.17% 25.06% 1939 14 1940 1941 15 16 17 5.40% -2.02% 2.29% 0.08% 0.34% 0.38% 1942 1943 18 1944 19.03% 2.49% 2.58% 3.80% 3.13% 19 0.38% 0.38% 0.38% 1945 1946 20 21 1947 35.82% -8.43% 5.20% 5.70% % 18.30% 0.57% 22 1948 1.02% 0.92% 1.95% 4.66% 0.43% 23 1949 24 1950 30.81% 23.68% 25 1951 1.10% 1.17% 1.48% 1.67% 1.89% -0.30% 26 1952 18.15% -1.21% 27 28 1953 1954 1955 1956 1957 29 52.56% 32.60% 7.44% 2.27% 4.14% 3.29% -1.34% -2.26% 0.96% 1.66% 2.56% 3.23% 30 31 32 1958 1.78% 3.26% 33 1959 -10.46% 43.72% 12.06% 0.34% 26.64% -8.81% 34 1960 3.05% 2.27% 6.80% -2.10% -2.65% 11.64% 2.06% 5.69% 1.68% 35 1961 1962 36 37 38 1963 2.78% 3.11% 3.51% 3.90% 22.61% 16.42% 12.40% 1964 3.73% 39 1965 40 4.84% 1966 1967 -9.97% 23.80% 0.72% 2.91% -1.58% 3.27% % 41 4.33% 5.26% 42 10.81% 1968 1969 43 6.56% -5.01% 44 1970 -8.24% 3.56% 14.22% 18.76% 16.75% 9.79% 45 1971 6.69% 4.54% 3.95% 6.73% 46 1972 2.82% 3.66% 47 1973 48 7.78% 1.99% 1974 1975 49 5.99% 4.97% 1976 -14.31% -25.90% 37.00% 23.83% -6.98% 6.51% 18.52% 50 51 3.61% 15.98% 1.29% -0.78% 1977 52 1978 0.67% 53 54 1979 1980 31.74% -2.99% 55 1981 -4.70% 5.13% 6.93% 9.94% 11.22% 14.30% 11.01% 8.45% 9.61% 7.49% 8.20% 32.81% 56 1982 1983 57 58 20.42% 22.34% 6.15% 1984 3.20% 13.73% 25.71% 59 1985 31.24% -4.70% 14.30% 8.20% 1981 1982 11.01% 32.81% 20.42% 22.34% 1983 8.45% 3.20% 13.73% 1984 6.15% 9.61% 1985 31.24% 1986 18.49% 5.81% 7.49% 6.04% 5.72% 25.71% 24.28% -4.96% 1987 1988 16.54% 6.45% 1989 31.48% 8.11% 1990 -3.06% 7.55% 8.22% 17.69% 6.24% 15.00% 9.36% 1991 5.61% 30.23% 7.49% 1992 3.41% 9.97% 1.33% 2.98% 3.99% 1993 1994 1995 1996 14.21% -8.04% 23.48% 1.43% 5.52% 5.02% 1997 1998 37.20% 22.68% 33.10% 28.34% 20.89% -9.03% 5.05% 4.73% 9.94% 14.92% -8.25% 16.66% 1999 2000 4.51% 5.76% 3.67% 1.66% 2001 -11.85% -21.97% 5.57% 15.12% 2002 2003 28.36% 1.03% 0.38% 2004 10.74% 4.49% 1.23% 3.01% 2005 4.83% 2.87% 2006 15.61% 4.68% 1.96% 2007 4.64% 5.48% -36.55% 2008 1.59% 0.14% 2009 25.94% 10.21% 20.10% -11.12% 8.46% 16.04% 2.97% 14.82% 0.13% 0.03% 0.05% 2010 2011 2012 2013 2014 2015 2.10% 15.89% 32.15% 13.52% 1.38% 0.07% -9.10% 10.75% 0.05% 0.21% 1.28% 2016 0.69% 2017 2.80% 11.77% 21.64% -4.23% 31.22% 0.51% 1.39% 2.37% 1.55% 2018 2019 -0.02% 9.64% 11.33% 2020 18.01% 0.09%Step by Step Solution
There are 3 Steps involved in it
Step: 1

Get Instant Access to Expert-Tailored Solutions
See step-by-step solutions with expert insights and AI powered tools for academic success
Step: 2

Step: 3
Ace Your Homework with AI
Get the answers you need in no time with our AI-driven, step-by-step assistance
Get Started
The Investing Revolutionaries How The Worlds Greatest Investors Take On Wall Street And Win In Any Market
Authors: James N. Whiddon , Nikki Knotts
1st Edition
0071623949,0071700560