Answered step by step
Verified Expert Solution
Link Copied!

Question

1 Approved Answer

The Adstock Model is fitted to monthly data and yields lambda = 0.7. What is the half-life of advertising? This spreadsheet should help you test

The Adstock Model is fitted to monthly data and yields lambda = 0.7. What is the "half-life" of advertising? This spreadsheet should help you test your answer.image text in transcribed

\begin{tabular}{|c|c|c|c|c|c|c|c|c|c|c|c|} \hline & C & D & E & F & G & H & I & J & K & L & M \\ \hline 1 & & & & & & intialadstock & 35.295 & & & adeffect & 4.996 \\ \hline 2 & & & & & & & & & & elasticity & 1.488 \\ \hline 3 & & & & & & & & MAPE & & trend & 1.097 \\ \hline 4 & & & & & & & & 0.022 & & lambda & 0.831 \\ \hline 5 & QuarterofYear & Quarter\# & Ads & Adstock & Price & forecast & actual & APE & & const & 502.993 \\ \hline 6 & 1 & 1 & 44 & 73.336 & 44.000 & 2.633 & 2.639 & 0.002 & & 1 & 0.798 \\ \hline 7 & 2 & 2 & 78 & 138.953 & 42.000 & 3.510 & 3.486 & 0.007 & & 2 & 0.702 \\ \hline 8 & 3 & 3 & 59 & 174.492 & 35.000 & 6.425 & 6.156 & 0.044 & & 3 & 0.828 \\ \hline 9 & 4 & 4 & 72 & 217.030 & 40.000 & 12.547 & 12.561 & 0.001 & & 4 & 1.672 \\ \hline 10 & 1 & 5 & 47 & 227.385 & 37.000 & 7.185 & 7.263 & 0.011 & & & \\ \hline 11 & 2 & 6 & 45 & 233.992 & 37.000 & 6.676 & 6.354 & 0.051 & & mean & 1.000 \\ \hline 12 & 3 & 7 & 34 & 228.484 & 37.000 & 8.107 & 8.030 & 0.010 & & & \\ \hline 13 & 4 & 8 & 31 & 220.905 & 43.000 & 13.431 & 13.892 & 0.033 & & & \\ \hline 14 & 1 & 9 & 80 & 263.607 & 43.000 & 7.354 & 7.566 & 0.028 & & & \\ \hline 15 & 2 & 10 & 49 & 268.098 & 44.000 & 6.586 & 6.761 & 0.026 & & & \\ \hline 16 & 3 & 11 & 57 & 279.831 & 39.000 & 9.956 & 9.074 & 0.097 & & & \\ \hline 17 & 4 & 12 & 65 & 297.583 & 45.000 & 17.546 & 16.655 & 0.054 & & & \\ \hline 18 & 1 & 13 & 54 & 301.337 & 40.000 & 10.541 & 10.517 & 0.002 & & & \\ \hline 19 & 2 & 14 & 40 & 290.458 & 43.000 & 8.604 & 8.647 & 0.005 & & & \\ \hline 20 & 3 & 15 & 58 & 299.415 & 42.000 & 11.239 & 11.271 & 0.003 & & & \\ \hline 21 & 4 & 16 & 23 & 271.860 & 36.000 & 29.014 & 29.031 & 0.001 & & & \\ \hline 22 & 1 & 17 & 25 & 250.958 & 43.000 & 10.973 & 10.929 & 0.004 & & & \\ \hline 23 & 2 & 18 & 40 & 248.585 & 43.000 & 10.232 & 9.856 & 0.038 & & & \\ \hline 24 & 3 & 19 & 26 & 232.613 & 43.000 & 12.641 & 12.661 & 0.002 & & & \\ \hline 25 & 4 & 20 & 30 & 223.337 & 43.000 & 27.006 & 26.056 & 0.036 & & & \\ \hline 26 & 1 & 21 & 69 & 254.628 & 43.000 & 14.297 & 13.730 & 0.041 & & & \\ \hline 27 & 2 & 22 & 28 & 239.635 & 43.000 & 13.268 & 13.513 & 0.018 & & & \\ \hline 28 & 3 & 23 & 55 & 254.174 & 43.000 & 17.058 & 17.161 & 0.006 & & & \\ \hline 29 & 4 & 24 & 54 & 265.258 & 39.000 & 43.195 & 43.227 & 0.001 & & & \\ \hline \end{tabular}

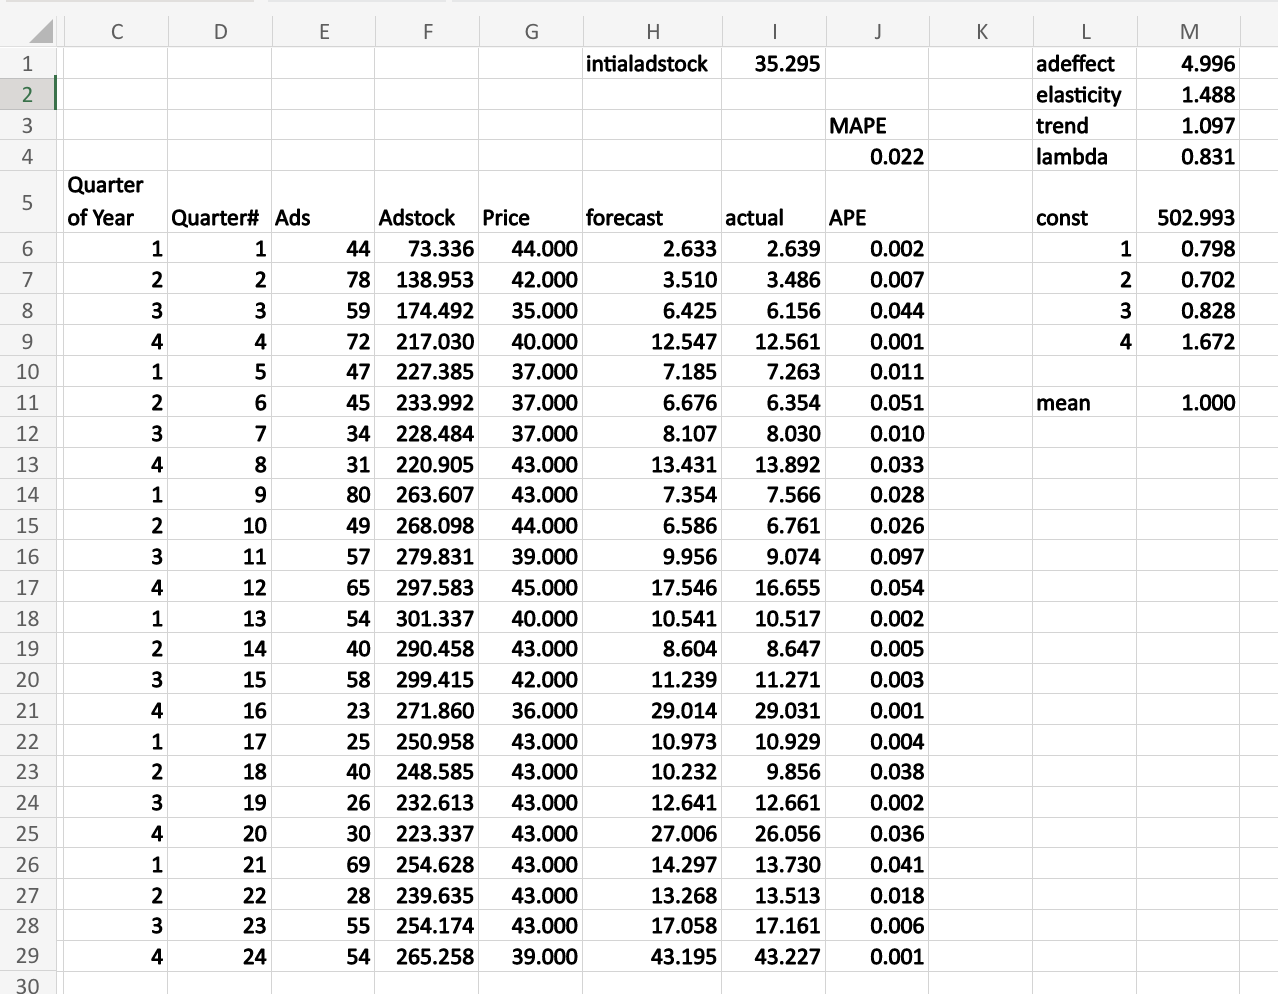
Step by Step Solution

There are 3 Steps involved in it

Step: 1

blur-text-image

Get Instant Access to Expert-Tailored Solutions

See step-by-step solutions with expert insights and AI powered tools for academic success

Step: 2

blur-text-image

Step: 3

blur-text-image

Ace Your Homework with AI

Get the answers you need in no time with our AI-driven, step-by-step assistance

Get Started

Recommended Textbook for

Supply Chain Finance Solutions

Authors: Erik Hofmann, Oliver Belin

1st Edition

3642175651, 978-3642175657

More Books

Students also viewed these Finance questions